Export tables to Excel
Update 07 June 2018: See Export tabulation results to Excel—Update for new features that have been added since this original blog.
There is a new command in Stata 13, putexcel, that allows you to easily export matrices, expressions, and stored results to an Excel file. Combining putexcel with a Stata command’s stored results allows you to create the table displayed in your Stata Results window in an Excel file.
A stored result is simply a scalar, macro, or matrix stored in memory after you run a Stata command. The two main types of stored results are e-class (for estimation commands) and r-class (for general commands). You can list a command’s stored results after it has been run by typing ereturn list (for estimation commands) and return list (for general commands). Let’s try a simple example by loading the auto dataset and running correlate on the variables foreign and mpg
. sysuse auto
(1978 Automobile Data)

. correlate foreign mpg
(obs=74)

             |  foreign      mpg
-------------+------------------
     foreign |   1.0000
         mpg |   0.3934   1.0000
Because correlate is not an estimation command, use the return list command to see its stored results.
. return list

scalars:
                  r(N) =  74
                r(rho) =  .3933974152205484

matrices:
                  r(C) :  2 x 2
Now we can use putexcel to export these results to Excel. The basic syntax of putexcel is
putexcel excel_cell=(expression) … using filename [, options]
If you are working with matrices, the syntax is
putexcel excel_cell=matrix(expression) … using filename [, options]
It is easy to build the above syntax in the putexcel dialog. There is a helpful video on Youtube about the dialog here. Let’s list the matrix r(C) to see what it contains.
. matrix list r(C)

symmetric r(C)[2,2]
           foreign        mpg
foreign          1
    mpg  .39339742          1
To re-create the table in Excel, we need to export the matrix r(C) with the matrix row and column names. The command to type in your Stata Command window is
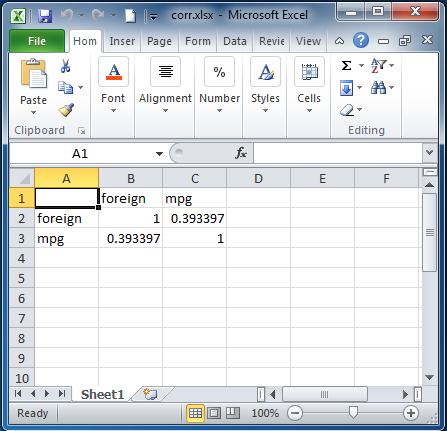
putexcel A1=matrix(r(C), names) using corr
Note that to export the matrix row and column names, we used the names option after we specifed the matrix r(C). When I open the file corr.xlsx in Excel, the table below is displayed.
Next let’s try a more involved example. Load the auto dataset, and run a tabulation on the variable foreign. Because tabulate is not an estimation command, use the return list command to see its stored results.
. sysuse auto
(1978 Automobile Data)

. tabulate foreign

   Car type |      Freq.     Percent        Cum.
------------+-----------------------------------
   Domestic |         52       70.27       70.27
    Foreign |         22       29.73      100.00
------------+-----------------------------------
      Total |         74      100.00

. return list

scalars:
                  r(N) =  74
                  r(r) =  2
tabulate is different from most commands in Stata in that it does not automatically save all the results we need into the stored results (we will use scalar r(N)). We need to use the matcell() and matrow() options of tabulate to save the results produced by the command into two Stata matrices.
. tabulate foreign, matcell(freq) matrow(names)

   Car type |      Freq.     Percent        Cum.
------------+-----------------------------------
   Domestic |         52       70.27       70.27
    Foreign |         22       29.73      100.00
------------+-----------------------------------
      Total |         74      100.00

. matrix list freq

freq[2,1]
    c1
r1  52
r2  22

. matrix list names

names[2,1]
    c1
r1   0
r2   1
The putexcel commands used to create a basic tabulation table in Excel column 1 row 1 are
putexcel A1=("Car type") B1=("Freq.") C1=("Percent") using results, replace
putexcel A2=matrix(names) B2=matrix(freq) C2=matrix(freq/r(N)) using results,
     modify
Below is the table produced in Excel by these commands.
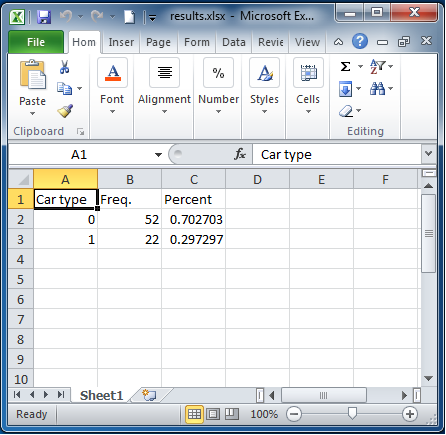
Again this is a basic tabulation table. You probably noticed that we did not have the Cum. column or the Total row in the export table. Also our Car type column contains the numeric values (0,1), not the value lables (Domestic, Foreign) of the variable foreign, and our Percent column is not formatted correctly. To get the exact table displayed in the Results window into an Excel file takes a little programming. With a few functions and a forvalues loop, we can easily export any table produced by running the tabulate command on a numeric variable.
There are two extended macro functions, label and display, that can help us. The label function can extract the value labels for each variable, and the display function can correctly format numbers for our numeric columns. Last, we use forvalues to loop over the rows of the returned matrices to produce our final tables. Our do-file to produce the tabulate table in Excel looks like
sysuse auto
tabulate foreign, matcell(freq) matrow(names)
putexcel A1=("Car type") B1=("Freq.") C1=("Percent") D1=("Cum.") using results, replace
local rows = rowsof(names)
local row = 2
local cum_percent = 0
forvalues i = 1/`rows' {
local val = names[`i',1]
local val_lab : label (foreign) `val'
local freq_val = freq[`i',1]
local percent_val = `freq_val'/`r(N)'*100
local percent_val : display %9.2f `percent_val'
local cum_percent : display %9.2f (`cum_percent' + `percent_val')
putexcel A`row'=("`val_lab'") B`row'=(`freq_val') C`row'=(`percent_val') ///
D`row'=(`cum_percent') using results, modify
local row = `row' + 1
}
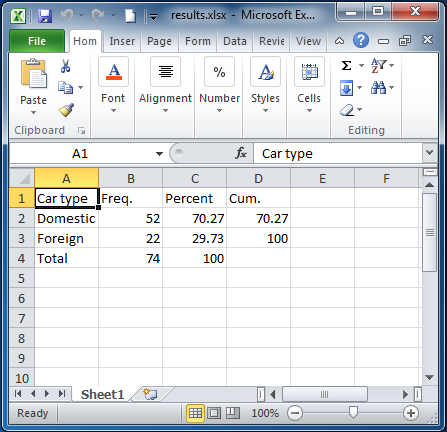
putexcel A`row'=("Total") B`row'=(r(N)) C`row'=(100.00) using results, modify
The above commands produce this table in Excel:
The solution above works well for this one table, but what if we need to export the tabulation table for 100 variables to the same Excel spreadsheet? It would be very tedious to run the same do-file 100 times, each time changing the cell and row numbers. Now we could easily change our do-file into the Stata command (ado-file) called tab2xl. The syntax for our new command could be
tab2xl varname using filename, row(rownumber) col(colnumber) [replace sheet(name)]
The pseudocode of our program (file tab2xl.ado) looks like
program tab2xl
  /* parse command syntax */

  /* tabulate varname */

  /* get column letters based on starting column number passed in */

  /* write header row to filename in starting row number passed in */

  /* loop over rows of returned matrix and calculate/write values to filename */

  /* write total row to filename */
end
If you would like to download a working version of our tab2xl command, type
net install http://www.stata.com/users/kcrow/tab2xl
in Stata.