Import COVID-19 data from Johns Hopkins University
Like many of you, I am working from home and checking the latest news on COVID-19 frequently. I see a lot of numbers and graphs, so I looked around for the “official data”. One of the best data sources I have found is at the GitHub website for Johns Hopkins Whiting School of Engineering Center for Systems Science and Engineering. The data for each day are stored in a separate file, so I wrote a little Stata command called covid19 to download, combine, save, and graph these data.
The command creates a table that contains the date, the number of confirmed cases, the number of deaths, and the number recovered. I added a calculated variable named newcases, which is the difference between confirmed cases for two contiguous days.
The original data include all reporting countries, so I added a country() option that allows me to view the table for a particular country.
. covid19, country("US") graph saving(covid19_usa)

   COVID-19 data for US as of 19 Mar 2020

  +--------------------------------------------------------+
  |       date   confirmed   newcases   deaths   recovered |
  |--------------------------------------------------------|
  | 01/22/2020           1          1        0           0 |
  | 01/23/2020           1          0        0           0 |
  | 01/24/2020           2          1        0           0 |
  | 01/25/2020           2          0        0           0 |

                     (Output omitted)

  | 03/14/2020        2726        547       54          12 |
  | 03/15/2020        3499        773       63          12 |
  | 03/16/2020        4632       1133       85          17 |
  | 03/17/2020        6421       1789      108          17 |
  | 03/18/2020        7786       1365      118         106 |
  +--------------------------------------------------------+
I also added a graph option that plots the number of confirmed cases.
Figure 1: Confirmed cases of COVID-19 in the United States

The saving() option saves the data to a file named covid19_usa.dta.
. use covid19_usa, clear

. list in -10/l

     +------------------------------------------------------+
     |       date   confir~d   newcases   deaths   recove~d |
     |------------------------------------------------------|
 48. | 03/09/2020        605         68       22          8 |
 49. | 03/10/2020        959        354       28          8 |
 50. | 03/11/2020       1281        322       36          8 |
 51. | 03/12/2020       1663        382       40         12 |
 52. | 03/13/2020       2179        516       47         12 |
     |------------------------------------------------------|
 53. | 03/14/2020       2726        547       54         12 |
 54. | 03/15/2020       3499        773       63         12 |
 55. | 03/16/2020       4632       1133       85         17 |
 56. | 03/17/2020       6421       1789      108         17 |
 57. | 03/18/2020       7786       1365      118        106 |
     +------------------------------------------------------+
I like my covid19 command, but I have no plans to distribute it. I haven’t tested it thoroughly, and it could be rendered useless if or when Johns Hopkins changes its data. So I’m going to show you the steps to download and process the data so you can do this yourself. If the data change, you’ll have the tools to modify your code and download future data.
Johns Hopkins University GitHub data
GitHub is a popular website/platform for software development and distribution. The Johns Hopkins Whiting School of Engineering Center for Systems Science and Engineering has a GitHub repository that includes regularly updated COVID-19 data from around the world. The raw data are available here: Johns Hopkins GitHub data.
Figure 2: Johns Hopkins GitHub data for COVID-19
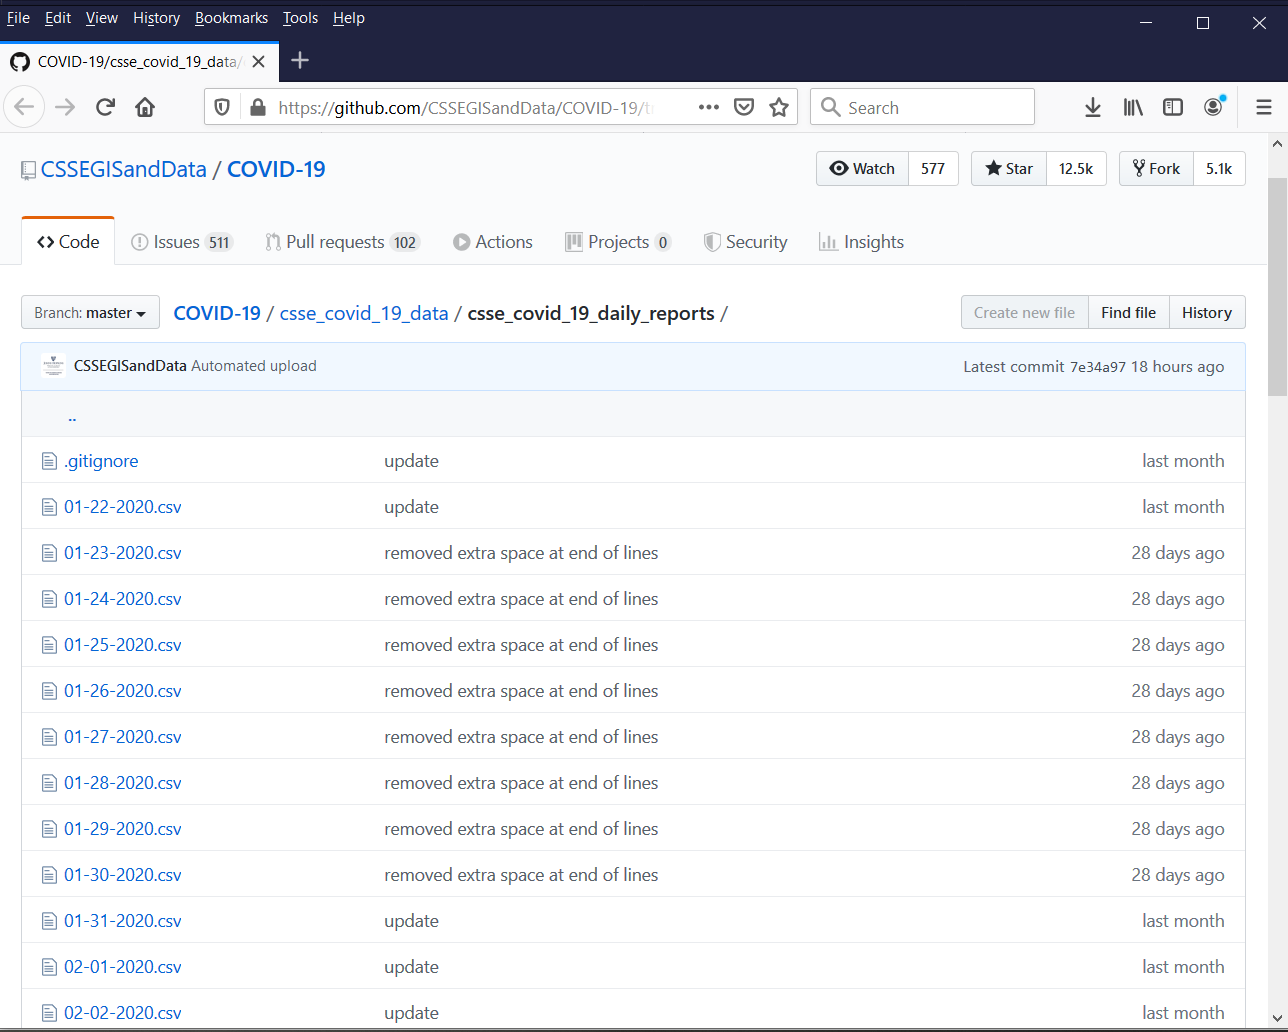
The data are stored in separate .csv files for each day. Let’s click on the file named 01-29-2020.csv to view its contents. This file contains data for the Province/State, the Country/Region, the date and time of the Last Update, the number of Confirmed cases, the number of Deaths, and the number Recovered.
Figure 3: Contents of 01-29-2020.csv
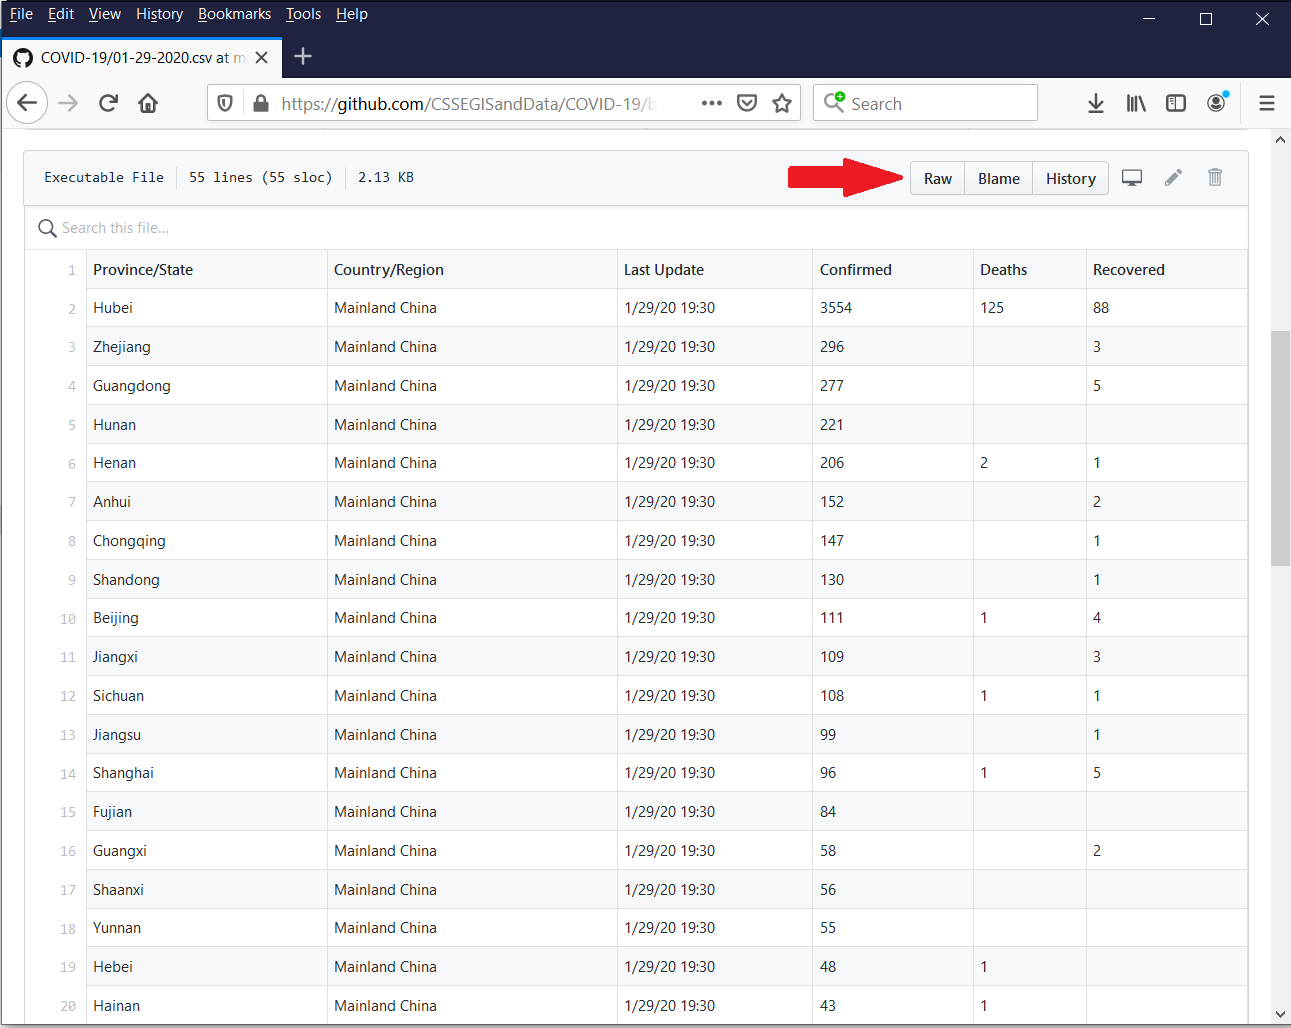
You can view the raw, comma-delimited data by clicking on the “Raw” button next to the red arrow. Note that I added the red arrow; it does not appear on the website.
Figure 4: Raw comma-delimited data in 01-29-2020.csv
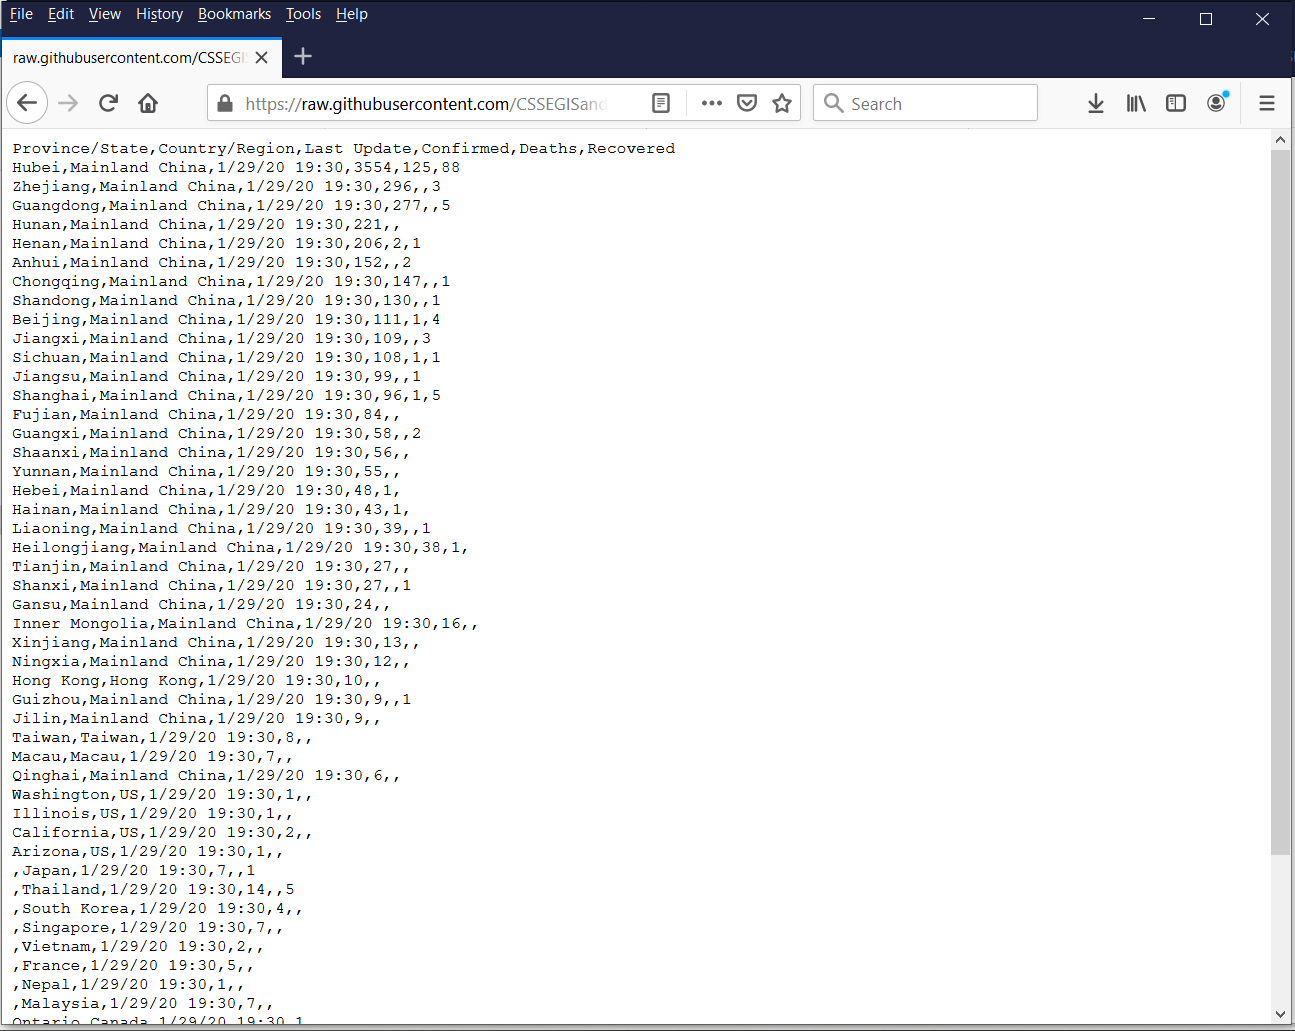
You can import these raw data from the website into Stata using import delimited. The filename is the URL in the address bar of your web browser.
import delimited "https://raw.githubusercontent.com/CSSEGISandData/COVID-19/master/csse_covid_19_data/csse_covid_19_daily_reports/01-29-2020.csv"
Your web browser will likely wrap the URL to a second line. Note that this is a one-line command in Stata. I can then describe and list the data in Stata.
. describe

Contains data
  obs:            54
 vars:             6
------------------------------------------------------------------------
              storage   display    value
variable name   type    format     label      variable label
------------------------------------------------------------------------
ïprovincestate  str16   %16s                  Province/State
countryregion   str20   %20s                  Country/Region
lastupdate      str13   %13s                  Last Update
confirmed       int     %8.0g                 Confirmed
deaths          int     %8.0g                 Deaths
recovered       byte    %8.0g                 Recovered
------------------------------------------------------------------------
Sorted by:
     Note: Dataset has changed since last saved.

. list in 1/5
   +---------------------------------------------------------------------------+
   | ïprovin~e    countryregion      lastupdate   confir~d   deaths   recove~d |
   |---------------------------------------------------------------------------|
1. |     Hubei   Mainland China   1/29/20 19:30       3554      125         88 |
2. |  Zhejiang   Mainland China   1/29/20 19:30        296        .          3 |
3. | Guangdong   Mainland China   1/29/20 19:30        277        .          5 |
4. |     Hunan   Mainland China   1/29/20 19:30        221        .          . |
5. |     Henan   Mainland China   1/29/20 19:30        206        2          1 |
   +---------------------------------------------------------------------------+
We did it! We successfully imported the raw data for January 29, 2020, from the Johns Hopkins GitHub repository into Stata! It’s only one file, and there is at least one obvious issue with the data (the variable named ïprovincestate), but it’s a good place to start.
Using confirm and if to fix variable names
I learned through trial and error that the variable provincestate is imported as ïprovincestate in some files and provincestate in others. We want to import many files, and we don’t want to have to look through each file manually. So let’s use confirm to check each file for a variable named ïprovincestate.
. confirm variable ïprovincestate

. display _rc
0
If the variable ïprovincestate exists, the command will store a value of zero to _rc. We can use this result in an if statement that will rename and correctly label the variable.
if _rc == 0 {

   rename ïprovincestate provincestate

   label variable provincestate "Province/State"

}
This dataset contains the variable ïprovincestate, so the commands inside the if block are executed. We can check this using describe.
. describe provincestate

              storage   display    value
variable name   type    format     label      variable label
------------------------------------------------------------------------
provincestate   str16   %16s                  Province/State
Our dataset now contains a variable named provincestate. Let’s type confirm variable again to see what happens if the variable ïprovincestate is not in our dataset.
. confirm variable ïprovincestate
variable ïprovincestate not found
r(111);
This dataset does not contain a variable named ïprovincestate, so confirm variable returns an error message. If we execute confirm variable within a do-file, the do-file will stop running. We can use capture to allow our do-file to continue running even if confirm variable returns an error.
. capture confirm variable ïprovincestate

. display _rc
111
Note that _rc equals 111, which is not equal to 0. So the code below will import the raw data and “fix” ïprovincestate if necessary.
import delimited "https://raw.githubusercontent.com/CSSEGISandData/COVID-19/master/csse_covid_19_data/csse_covid_19_daily_reports/01-29-2020.csv"

if _rc == 0 {

   rename ïprovincestate provincestate

   label variable provincestate "Province/State"

}
Using macros to import different files
Next let’s see how macros can help us import different files from the website. We can store words or numbers temporarily in memory using macros. Macros can be local or global. Global macros, once defined, are available anywhere in Stata. Local macros exist solely within the program or do-file in which they are defined. You can define a local macro like this:
. local today = "3-19-2020"
You can refer to the macro by typing a left single quote (to the left of the “one key”) on the left side of the macro name and a right single quote (to the left of the “Enter” key) on the right side of the macro name.
. display "`today'"
3-19-2020
We can create macros by combining other macros like this:
. local month = "3"

. local day = "19"

. local year = "2020"

. local today = "`month'-`day'-`year'"

. display "`today'"
3-19-2020
We wish to import files with names like 01-29-2020.csv. Note that the month includes a “leading zero”. Months 1–9 are specified as “01”, “02”, and so forth. Months 10–12 are specified as “10”, “11”, and “12”. We need a way to assign values to local macros that includes a leading zero when appropriate. The string() function is one way to do this.
. local month = string(3, "%02.0f")

. local day = string(19, "%02.0f")

. local year = "2020"

. local today = "`month'-`day'-`year'"

. display "`today'"
03-19-2020
The string() function for the macro month stored the number 3 to a two-character string with a leading zero. The string() function for the macro day stored the number 19 to a two-character string with a leading zero, but the leading zero is not necessary. This will allow us to specify arbitrary dates with the correct format for the files we wish to import.
Next, let’s consider the entire filename. Most of the lengthy filename is the same for every file. Let’s store the URL for the filenames to a local macro.
. local URL = "https://raw.githubusercontent.com/CSSEGISandData/
> COVID-19/master/csse_covid_19_data/csse_covid_19_daily_reports/"

. display "`URL'"
https://raw.githubusercontent.com/CSSEGISandData/COVID-19/master/
> csse_covid_19_data/csse_covid_19_daily_reports/
This allows us to specify a filename like this:
. local FileName = "`URL'`today'.csv"

. import delimited "`FileName'"
(8 vars, 284 obs)
Using loops to import multiple files
We can repeat a command or collection of commands by placing them in a loop. One way to do this is with forvalues.
forvalues month = 1/12 {

   display "month = `month'"

}
Note that month is stored as a local macro, and we can refer to it as `month’ inside the loop. So the results of our loop look like this:
. forvalues month = 1/12 {
  2.     display "month = `month'"
  3. }
month = 1
month = 2
month = 3
month = 4
month = 5
month = 6
month = 7
month = 8
month = 9
month = 10
month = 11
month = 12
We can also create a loop within a loop. For example, we could loop over days within months like this:
forvalues month = 1/12 {

   forvalues day = 1/31 {

      display "month = `month', day = `day'"

   }

}
The results of this loop are quite lengthy, so I have omitted most of the output.
. forvalues month = 1/12 {
  2.     forvalues day = 1/31 {
  3.         display "month = `month', day = `day'"
  4.     }
  5. }
month = 1, day = 1
month = 1, day = 2
month = 1, day = 3
month = 1, day = 4

(Output omitted)

month = 12, day = 28
month = 12, day = 29
month = 12, day = 30
month = 12, day = 31
Let’s use our loop to create names for the files we wish to download.
forvalues month = 1/12 {

   forvalues day = 1/31 {

      local month = string(`month', "%02.0f")

      local day   = string(`day', "%02.0f")

      local year  = "2020"

      local today = "`month'-`day'-`year'"

      display "`today'"

   }

}
This loop also returns a lot of output, so I have omitted most of it for brevity. Note that the string() function adds leading zeros for month and day where necessary.
. forvalues month = 1/12 {
  2.     forvalues day = 1/31 {
  3.         local month = string(`month', "%02.0f")
  4.         local day   = string(`day', "%02.0f")
  5.         local year  = "2020"
  6.         local today = "`month'-`day'-`year'"
  7.         display "`today'"
  8.     }
  9. }
01-01-2020
01-02-2020
01-03-2020
01-04-2020

(Output omitted)

12-28-2020
12-29-2020
12-30-2020
12-31-2020
We can use the macro URL along with import delimited to import the raw data for every day in 2020. We will need to clear Stata’s memory before we import each raw data file. Then, we can save a copy of each file as a Stata dataset.
local URL = "https://raw.githubusercontent.com/CSSEGISandData/COVID-19/master/csse_covid_19_data/csse_covid_19_daily_reports/"

forvalues month = 1/12 {

   forvalues day = 1/31 {

      local month    = string(`month', "%02.0f")

      local day      = string(`day', "%02.0f")

      local year     = "2020"

      local today    = "`month'-`day'-`year'"

      local FileName = "`URL'`today'.csv"

      clear

      import delimited "`FileName'"

      save "`today'"

   }

}
I’m sure you have already anticipated the flaw with the code above. It loops over every day of every month of 2020. But the data files begin on January 21, 2020, so there is no data file for January 1. Our program returns an error message.
. local URL = "https://raw.githubusercontent.com/CSSEGISandData/
> COVID-19/master/csse_covid_19_data/csse_covid_19_daily_reports/"

. forvalues month = 1/12 {
  2.     forvalues day = 1/31 {
  3.         local month    = string(`month', "%02.0f")
  4.         local day      = string(`day', "%02.0f")
  5.         local year     = "2020"
  6.         local today    = "`month'-`day'-`year'"
  7.         local FileName = "`URL'`today'.csv"
  8.         clear
  9.         import delimited "`FileName'"
 10.         save "`today'"
 11.     }
 12. }
file
    https://raw.githubusercontent.com/CSSEGISandData/COVID-19/master/
    > csse_covid_19_data/csse_covid_19_daily_reports/01-01-2020.csv not found
could not open url
r(603);
New data will also be added every day, and I would like to import future data once they are posted. There are many clever ways to handle this situation. One way is to simply precede import delimited and save with capture. Data files will be imported if they exist. If the data file does not exist, the program will continue. It’s a slow and crude method, but it will work for our purposes.
local URL = "https://raw.githubusercontent.com/CSSEGISandData/COVID-19/master/csse_covid_19_data/csse_covid_19_daily_reports/"

forvalues month = 1/12 {

   forvalues day = 1/31 {

      local month = string(`month', "%02.0f")

      local day = string(`day', "%02.0f")

      local year = "2020"

      local today = "`month'-`day'-`year'"

      local FileName = "`URL'`today'.csv"

      clear

      capture import delimited "`FileName'"

      capture save "`today'"

   }

}
Our capture trick worked, and I can view a list of the Stata data files in my local directory.
. ls3/19/20 16:23 . 3/19/20 16:23 .. 6.0k 3/19/20 16:23 01-22-2020.dta 6.3k 3/19/20 16:23 01-23-2020.dta 6.1k 3/19/20 16:23 01-24-2020.dta 6.2k 3/19/20 16:23 01-25-2020.dta (Output omitted) 30.0k 3/19/20 16:23 03-15-2020.dta 31.3k 3/19/20 16:23 03-16-2020.dta 31.7k 3/19/20 16:23 03-17-2020.dta 32.4k 3/19/20 16:23 03-18-2020.dta
Let’s open the file 01-22-2020.dta and describe the data.
. describe using 01-22-2020.dta

Contains data
  obs:            38                          19 Mar 2020 16:45
 vars:             6
------------------------------------------------------------------------
              storage   display    value
variable name   type    format     label      variable label
------------------------------------------------------------------------
ïprovincestate  str14   %14s                  Province/State
countryregion   str14   %14s                  Country/Region
lastupdate      str15   %15s                  Last Update
confirmed       int     %8.0g                 Confirmed
deaths          byte    %8.0g                 Deaths
recovered       byte    %8.0g                 Recovered
------------------------------------------------------------------------
Sorted by:
This is one of those files that contain the variable ïprovincestate. We learned how to fix this earlier using confirm and if, so let’s put our “fix” in our code and rerun it. Note that I have added the option , replace to the save commands because the files already exist in our directory.
local URL = "https://raw.githubusercontent.com/CSSEGISandData/COVID-19/master/csse_covid_19_data/csse_covid_19_daily_reports/"

forvalues month = 1/12 {

   forvalues day = 1/31 {

      local month = string(`month', "%02.0f")

      local day = string(`day', "%02.0f")

      local year = "2020"

      local today = "`month'-`day'-`year'"

      local FileName = "`URL'`today'.csv"

      clear

      capture import delimited "`FileName'"

      capture confirm variable ïprovincestate

      if _rc == 0 {

         rename ïprovincestate provincestate

         label variable provincestate "Province/State"

      }

   capture save "`today'", replace

   }

}
Now we can describe the dataset 01-22-2020.dta and verify that the variable ïprovincestate has been changed to provincestate.
. describe using 01-22-2020.dta

Contains data
  obs:            38                          19 Mar 2020 16:35
 vars:             6
------------------------------------------------------------------------
              storage   display    value
variable name   type    format     label      variable label
------------------------------------------------------------------------
provincestate   str14   %14s                  Province/State
countryregion   str14   %14s                  Country/Region
lastupdate      str15   %15s                  Last Update
confirmed       int     %8.0g                 Confirmed
deaths          byte    %8.0g                 Deaths
recovered       byte    %8.0g                 Recovered
------------------------------------------------------------------------
Sorted by:
Our local directory now contains a collection of Stata data files that we wish to combine into a single file. We can do this using append. We could append two data files manually like this:
. clear

. append using 01-22-2020.dta

. append using 01-23-2020.dta
But that would be tedious, and we would have to continually update our code. Another loop would allow us to automate this process. Note that I have used the capture trick before append because we don’t have a file for every day of 2020.
clear

forvalues month = 1/12 {

   forvalues day = 1/31 {

      local month = string(`month', "%02.0f")

      local day = string(`day', "%02.0f")

      local year = "2020"

      local today = "`month'-`day'-`year'"

      capture append using "`today'"

      }

}
I have described our data below and notice that there are two new variables. Some of the raw data files contain the variables latitude and longitude, and they have been appended to our full dataset.
. describe

Contains data
  obs:         6,722
 vars:             8
------------------------------------------------------------------------
              storage   display    value
variable name   type    format     label      variable label
------------------------------------------------------------------------
provincestate   str43   %43s                  Province/State
countryregion   str32   %32s                  Country/Region
lastupdate      str19   %19s                  Last Update
confirmed       long    %8.0g                 Confirmed
deaths          int     %8.0g                 Deaths
recovered       long    %8.0g                 Recovered
latitude        float   %9.0g                 Latitude
longitude       float   %9.0g                 Longitude
------------------------------------------------------------------------
Sorted by:
     Note: Dataset has changed since last saved.
A list of the last 10 observations confirms that the dataset includes some data for latitude and longitude.
. list countryregion latitude longitude in -10/l

      +---------------------------------------------+
      |         countryregion   latitude   longit~e |
      |---------------------------------------------|
7917. |                France   -12.8431    45.1383 |
7918. |                France   -21.1351    55.2471 |
7919. |             Greenland         72        -40 |
7920. |                  Guam    13.4443   144.7937 |
7921. |              Guernsey      49.45      -2.58 |
      |---------------------------------------------|
7922. |                Jersey      49.19      -2.11 |
7923. |           Puerto Rico       18.2      -66.5 |
7924. | Republic of the Congo      -1.44     15.556 |
7925. |           The Bahamas      24.25        -76 |
7926. |            The Gambia    13.4667      -16.6 |
      +---------------------------------------------+
Conclusion and goals for next time
Let’s stop here and think about what we have accomplished. We have successfully downloaded all the raw data available for COVID-19 from the Johns Hopkins GitHub repository and combined them into a single dataset using the following code:
local URL = "https://raw.githubusercontent.com/CSSEGISandData/COVID-19/master/csse_covid_19_data/csse_covid_19_daily_reports/"

forvalues month = 1/12 {

   forvalues day = 1/31 {

      local month = string(`month', "%02.0f")

      local day = string(`day', "%02.0f")

      local year = "2020"

      local today = "`month'-`day'-`year'"

      local FileName = "`URL'`today'.csv"

      clear

      capture import delimited "`FileName'"

      capture confirm variable ïprovincestate

      if _rc == 0 {

         rename ïprovincestate provincestate

         label variable provincestate "Province/State"

      }

      capture save "`today'", replace

   }

}

clear

forvalues month = 1/12 {

   forvalues day = 1/31 {

      local month = string(`month', "%02.0f")

      local day = string(`day', "%02.0f")

      local year = "2020"

      local today = "`month'-`day'-`year'"

      capture append using "`today'"

   }

}
Many of you will notice that we could accomplish this task with a single loop (hint: use frames!). But I wanted to keep things as simple as possible in this post. Let’s save this dataset so we can use it later.
. save covid19_raw
file covid19_raw.dta saved
There are many things we could do with this raw dataset. We could create time-series data to examine patterns over time. We could do this by country or even provinces or states within countries. And we have information about latitude and longitude for some of the data, so we could explore patterns by time and location. I’ll discuss these in future posts.
Please note that we have not checked and cleaned these data. The code above and the resulting data should be used for instructional purposes only.