New FAQs about customizable tables are here!
The new table features introduced in Stata 17 and Stata 18 have made it easy to create and customize tables of descriptive statistics, regression results, and more. These powerful features became popular among our users very soon after they were introduced, and we often get questions from users who want to know how to accomplish specific customizations for their tables. To provide our community with more learning resources, we carefully selected some of the questions that we answered frequently, and turned them into a series of example-enriched FAQs:
https://www.stata.com/support/faqs/reporting/
Here I’ll give you a preview of what you can learn in the new FAQs. Perhaps you have a table that looks like
------------------------------------------------------------------
                         Domestic        Foreign         Total
------------------------------------------------------------------
N                         52 (70.3%)     22 (29.7%)    74 (100.0%)
Trunk space (cu. ft.) 14.750 (4.306) 11.409 (3.217) 13.757 (4.277)
Mileage (mpg)         19.827 (4.743) 24.773 (6.611) 21.297 (5.786)
Repair record 1978
  1                         2 (4.2%)       0 (0.0%)       2 (2.9%)
  2                        8 (16.7%)       0 (0.0%)      8 (11.6%)
  3                       27 (56.2%)      3 (14.3%)     30 (43.5%)
  4                        9 (18.8%)      9 (42.9%)     18 (26.1%)
  5                         2 (4.2%)      9 (42.9%)     11 (15.9%)
------------------------------------------------------------------
but you wonder how to insert a p-value obtained from a logistic regression, resulting in a table that looks like
--------------------------------------------------------------------------
                         Domestic        Foreign         Total     p-value
--------------------------------------------------------------------------
N                         52 (70.3%)     22 (29.7%)    74 (100.0%)
Trunk space (cu. ft.) 14.750 (4.306) 11.409 (3.217) 13.757 (4.277)
Mileage (mpg)         19.827 (4.743) 24.773 (6.611) 21.297 (5.786)
Repair record 1978
  1                         2 (4.2%)       0 (0.0%)       2 (2.9%)  0.0005
  2                        8 (16.7%)       0 (0.0%)      8 (11.6%)
  3                       27 (56.2%)      3 (14.3%)     30 (43.5%)
  4                        9 (18.8%)      9 (42.9%)     18 (26.1%)
  5                         2 (4.2%)      9 (42.9%)     11 (15.9%)
--------------------------------------------------------------------------
In FAQ: How do I insert a customized statistic in an existing table?, we demonstrate how to insert custom content into a table to get the exact look you want.
You may also want to change the font, style, and background color for certain cells of your table, generating a table that looks like
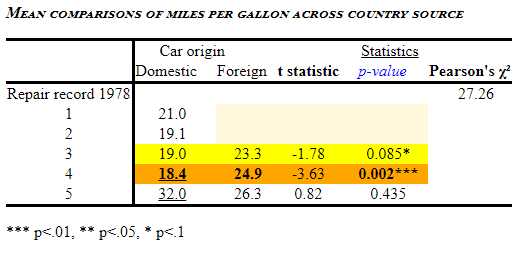
but are not sure how to do so. You can learn by reading FAQ: How can I customize my table to add cell shading, bold formatting, and underline texts?
Or you may be curious about how to change a table’s layout from
-----------------------------------------------------------------
           |            Mean                Standard deviation
           |     Price   Mileage (mpg)      Price   Mileage (mpg)
-----------+-----------------------------------------------------
Car origin |
  Domestic |  6072.423        19.82692   3097.104        4.743297
  Foreign  |  6384.682        24.77273   2621.915        6.611187
  Total    |  6165.257         21.2973   2949.496        5.785503
-----------------------------------------------------------------
to
---------------------------------------------------------------------------
           |          Mileage (mpg)                       Price
           |      Mean   Standard deviation       Mean   Standard deviation
-----------+---------------------------------------------------------------
Car origin |
  Domestic |  19.82692             4.743297   6072.423             3097.104
  Foreign  |  24.77273             6.611187   6384.682             2621.915
---------------------------------------------------------------------------
or even to
Price
-------------------------------------------
           |      Mean   Standard deviation
-----------+-------------------------------
Car origin |
  Domestic |  6072.423             3097.104
  Foreign  |  6384.682             2621.915
  Total    |  6165.257             2949.496
-------------------------------------------

Mileage (mpg)
-------------------------------------------
           |      Mean   Standard deviation
-----------+-------------------------------
Car origin |
  Domestic |  19.82692             4.743297
  Foreign  |  24.77273             6.611187
  Total    |   21.2973             5.785503
-------------------------------------------
To learn how, you can read FAQ: How do I change a table’s layout using collect layout?
Besides generating tables, we also have guidance on how to export the table to other file formats in FAQ: What methods can we use to export a customizable table from Stata to another format?
More specifically, to learn how to export multiple tables into one file, which is more involved than exporting a single table, you can read FAQ: How can I export multiple tables to one file? In this FAQ, we also demonstrate how to generate an HTML file with a special-styled table that looks like
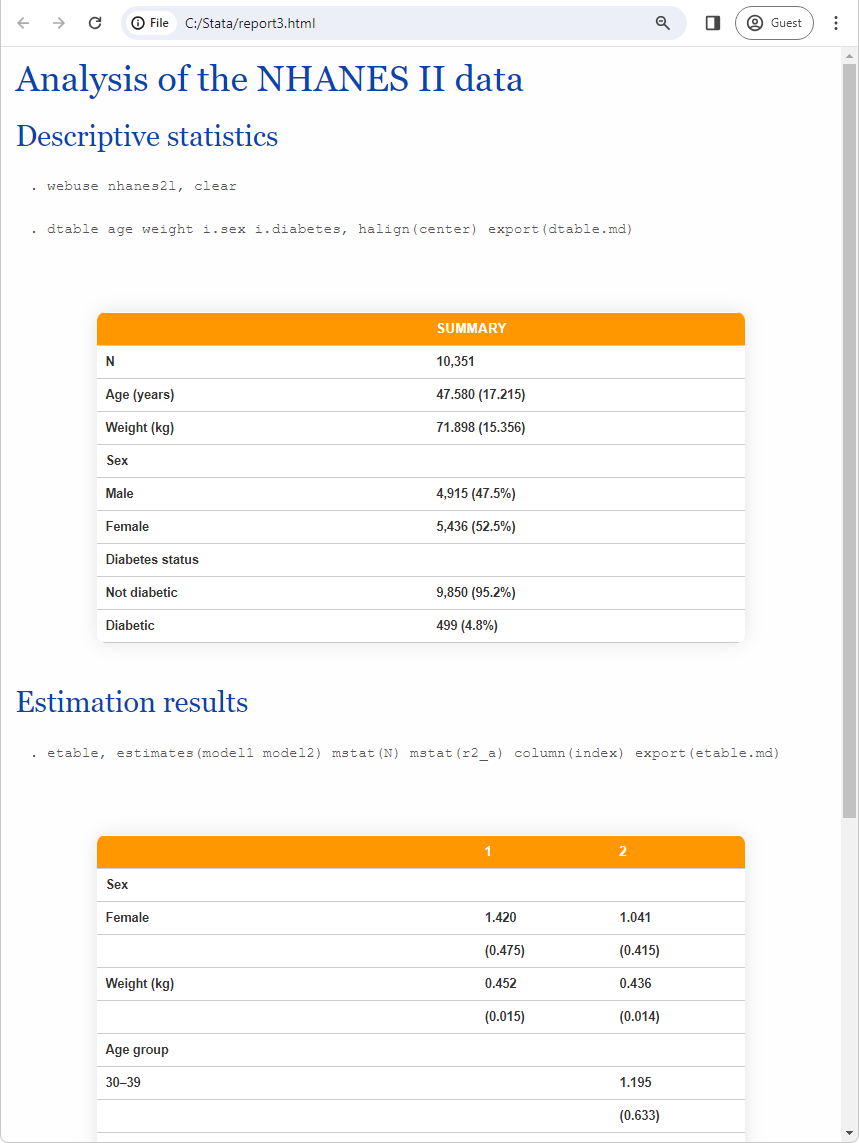
And there is much more. We have an entirely new series of FAQs to show you how to customize your tables and export them in various ways:
How to transpose a table generated with collect/table/dtable/etable?
How to reshape a table?
How can I create table layouts from scratch by using collect get?
How can I remove rows or columns from a table generated with collect, table, or dtable?
How do I change a table’s layout using collect layout?
How can I export multiple tables to one file?
What are the autolevels of a dimension in a table (collection)?
Combine multiple tables obtained with table or dtable using collect
What methods can we use to export a customizable table from Stata to another format?
How can I customize my table to add cell shading, bold formatting, and underline texts?
How can I easily create and export a table of regression results from Stata to other formats?
Which versions of Stata have the table, dtable, etable, and collect commands?
What official resources are available for learning about the collect/table/etable/dtable commands?
I hope you will check out these new resources and see if they can help you make your customized tables exactly the way you want!