Building complicated expressions the easy way
Have you every wanted to make an “easy” calculation–say, after fitting a model–and gotten lost because you just weren’t sure where to find the degrees of freedom of the residual or the standard error of the coefficient? Have you ever been in the midst of constructing an “easy” calculation and was suddenly unsure just what e(df_r) really was? I have a solution.
It’s called Stata’s expression builder. You can get to it from the display dialog (Data->Other Utilities->Hand Calculator)
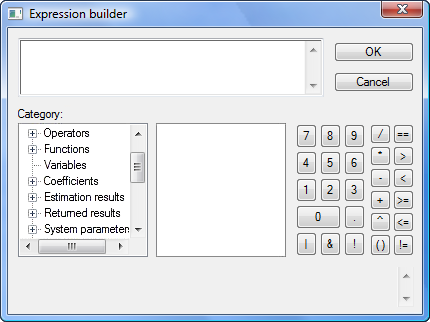
In the dialog, click the Create button to bring up the builder. Really, it doesn’t look like much:
I want to show you how to use this expression builder; if you’ll stick with me, it’ll be worth your time.
Let’s start over again and assume you are in the midst of an analysis, say,
. sysuse auto, clear
. regress price mpg length
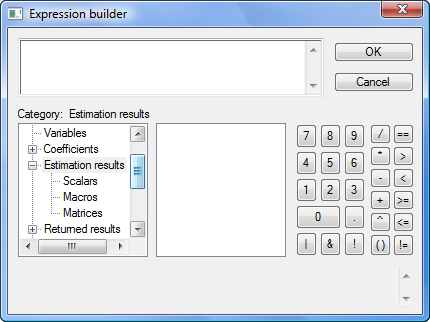
Next invoke the expression builder by pulling down the menu Data->Other Utilities->Hand Calculator. Click Create. It looks like this:
Now click on the tree node icon (+) in front of “Estimation results” and then scroll down to see what’s underneath. You’ll see
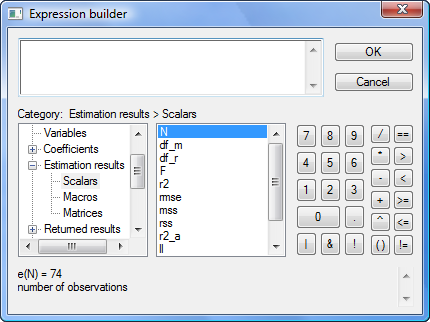
Click on Scalars:
The middle box now contains the scalars stored in e(). N happens to be highlighted, but you could click on any of the scalars. If you look below the two boxes, you see the value of the e() scalar selected as well as its value and a short description. e(N) is 74 and is the “number of observations”.
It works the same way for all the other categories in the box on the left: Operators, Functions, Variables, Coefficients, Estimation results, Returned results, System parameters, Matrices, Macros, Scalars, Notes, and Characteristics. You simply click on the tree node icon (+), and the category expands to show what is available.
You have now mastered the expression builder!
Let’s try it out.
Say you want to verify that the p-value of the coefficient on mpg is correctly calculated by regress–which reports 0.052–or more likely, you want to verify that you know how it was calculated. You think the formula is

or, as an expression in Stata,
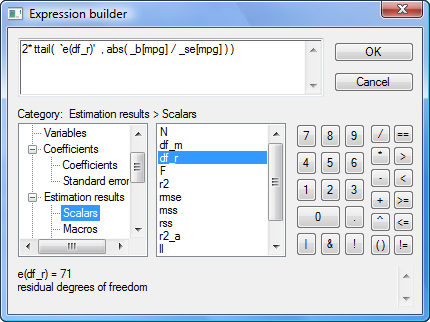
2*ttail(e(df_r), abs(_b[mpg]/_se[mpg]))
But I’m jumping ahead. You may not remember that _b[mpg] is the coefficient on variable mpg, or that _se[mpg] is its corresponding standard error, or that abs() is Stata’s absolute value function, or that e(df_r) is the residual degrees of freedom from the regression, or that ttail() is Stata’s Student’s t distribution function. We can build the above expression using the builder because all the components can be accessed through the builder. The ttail() and abs() functions are in the Functions category, the e(df_r) scalar is in the Estimation results category, and _b[mpg] and _se[mpg] are in the Coefficients category.
What’s nice about the builder is that not only are the item names listed but also a definition, syntax, and value are displayed when you click on an item. Having all this information in one place makes building a complex expression much easier.
Another example of when the expression builder comes in handy is when computing intraclass correlations after xtmixed. Consider a simple two-level model from Example 1 in [XT] xtmixed, which models weight trajectories of 48 pigs from 9 successive weeks:
. use http://www.stata-press.com/data/r12/pig
. xtmixed weight week || id:, variance
The intraclass correlation is a nonlinear function of variance components. In this example, the (residual) intraclass correlation is the ratio of the between-pig variance, var(_cons), to the total variance, between-pig variance plus residual (within-pig) variance, or var(_cons) + var(residual).
The xtmixed command does not store the estimates of variance components directly. Instead, it stores them as log standard deviations in e(b) such that _b[lns1_1_1:_cons] is the estimated log of between-pig standard deviation, and _b[lnsig_e:_cons] is the estimated log of residual (within-pig) standard deviation. So to compute the intraclass correlation, we must first transform log standard deviations to variances:
exp(2*_b[lns1_1_1:_cons])
exp(2*_b[lnsig_e:_cons])
The final expression for the intraclass correlation is then
exp(2*_b[lns1_1_1:_cons]) / (exp(2*_b[lns1_1_1:_cons])+exp(2*_b[lnsig_e:_cons]))
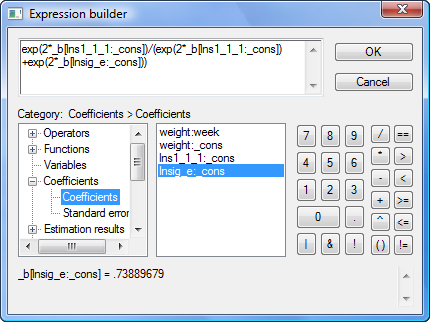
The problem is that few people remember that _b[lns1_1_1:_cons] is the estimated log of between-pig standard deviation. The few who do certainly do not want to type it. So use the expression builder as we do below:
In this case, we’re using the expression builder accessed from Stata’s nlcom dialog, which reports estimated nonlinear combinations along with their standard errors. Once we press OK here and in the nlcom dialog, we’ll see
. nlcom (exp(2*_b[lns1_1_1:_cons])/(exp(2*_b[lns1_1_1:_cons])+exp(2*_b[lnsig_e:_cons])))

  _nl_1:  exp(2*_b[lns1_1_1:_cons])/(exp(2*_b[lns1_1_1:_cons])+exp(2*_b[lnsig_e:_cons]))

------------------------------------------------------------------------------
      weight |      Coef.   Std. Err.      z    P>|z|     [95% Conf. Interval]
-------------+----------------------------------------------------------------
       _nl_1 |   .7717142   .0393959    19.59   0.000     .6944996    .8489288
------------------------------------------------------------------------------
The above could easily be extended to computing different types of intraclass correlations arising in higher-level random-effects models. The use of the expression builder for that becomes even more handy.

