Creating Excel tables with putexcel, part 1: Introduction and formatting
For a long time, I have wanted to type a Stata command like this,
. ExcelTable race, cont(age height weight) cat(sex diabetes)
The Excel table table.xlsx was created successfully
and get an Excel table that looks like this:
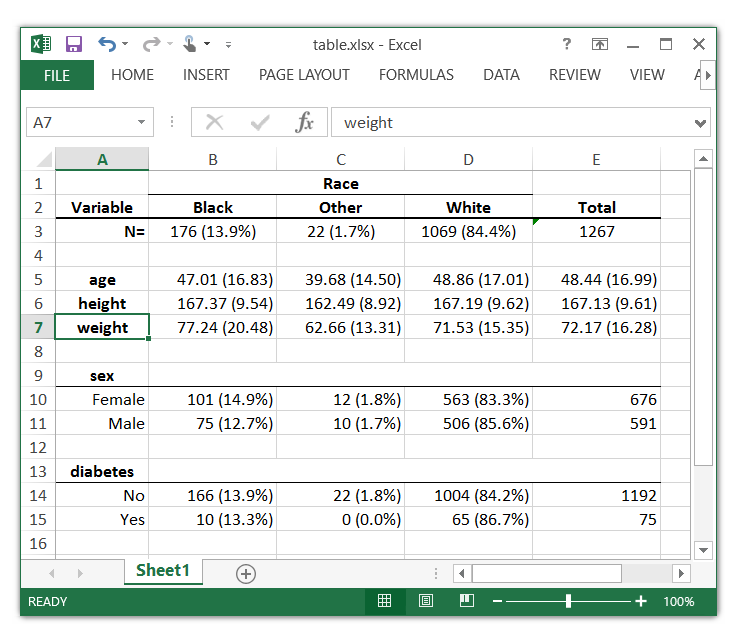
So I wrote a program called ExcelTable for my own use that creates Excel tables like the one in the screenshot. My guess is that many of you would like to have a similar program but you might prefer a different layout. Or maybe you would like to write a do-file that creates a similar table. I can’t possibly anticipate all the different layouts you might want, so I am going to write a series of blog posts to show you how to create your own Excel tables. I’ll even show you how to write your own version of ExcelTable. Today I am going to focus on formatting expressions and cells.
We have made some improvements to putexcel in Stata 14.2, so you will want to update your copy of Stata to run the examples below. You may recall that Kevin Crow has written two blog posts about putexcel titled Export tables to Excel and Retaining an Excel cell’s format when using putexcel. You will need to set your Stata version to 13.1 to run the examples in Kevin’s blog posts. It would be too distracting to list the differences between the putexcel syntax before and after Stata 14.2, so I am only going to show you the syntax as of Stata 14.2.
Example 1: Setting a destination file
Let’s begin by setting the destination file and sheet for our Excel table
. putexcel set Table1.xlsx, sheet(Sheet1) replace
Note: file will be replaced when the first putexcel command is issued
You must set a destination file before you run any other putexcel commands. All subsequent putexcel commands will write to Sheet1 in the file Table1.xlsx until you specify a different table with putexcel set.
Example 2: Writing a simple expression to Excel
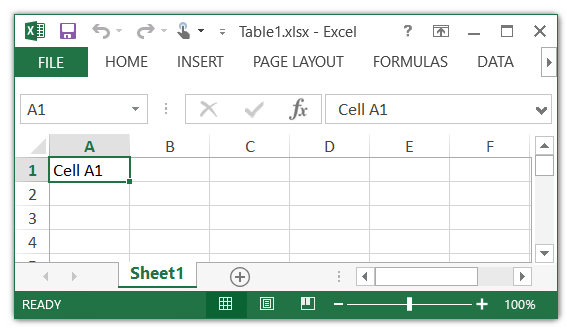
Next, let’s write an simple expression to Table1.
. putexcel A1 = "Cell A1"
file Table1.xlsx saved
Example 3: Specifying text alignment in cells
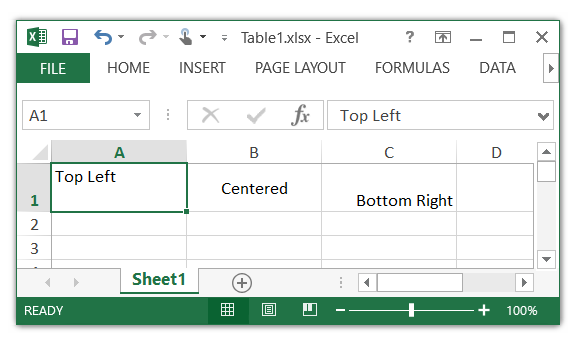
I can format expressions by adding options to putexcel. For example, I can specify the horizontal and vertical alignment of the expressions in the cells.
. putexcel set Table1.xlsx, sheet(Sheet1) replace
Note: file will be replaced when the first putexcel command is issued

. putexcel A1 = "Top Left", top left
file Table1.xlsx saved

. putexcel B1 = "Centered", vcenter hcenter
file Table1.xlsx saved

. putexcel C1 = "Bottom Right", bottom right
file Table1.xlsx saved
Example 4: Bold, italics, underline, and strikeout text
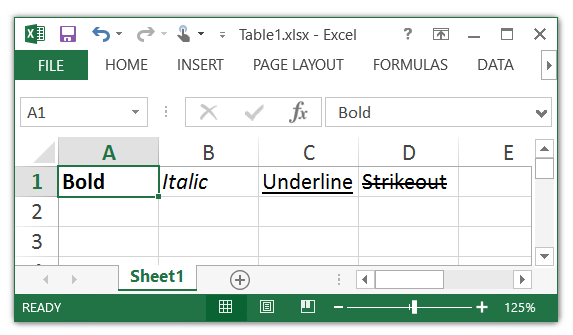
I can also write expressions using bold, italics, underline, or strikeout text.
. putexcel set Table1.xlsx, sheet(Sheet1) replace
Note: file will be replaced when the first putexcel command is issued

. putexcel A1 = "Bold", bold
file Table1.xlsx saved

. putexcel B1 = "Italic", italic
file Table1.xlsx saved

. putexcel C1 = "Underline", underline
file Table1.xlsx saved

. putexcel D1 = "Strikeout", strikeout
file Table1.xlsx saved
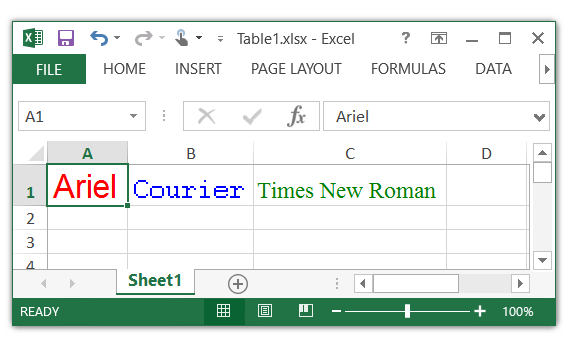
Example 5: Specifying the font, the font size, and the color
I can even specify the font, the font size, and the color using the font() option.
. putexcel set Table1.xlsx, sheet(Sheet1) replace
Note: file will be replaced when the first putexcel command is issued

. putexcel A1 = "Ariel", font(ariel, 20 , red)
file Table1.xlsx saved

. putexcel B1 = "Courier", font(courier, 16 , blue)
file Table1.xlsx saved

. putexcel C1 = "Times New Roman", font(timesnewroman, 14 , green)
file Table1.xlsx saved
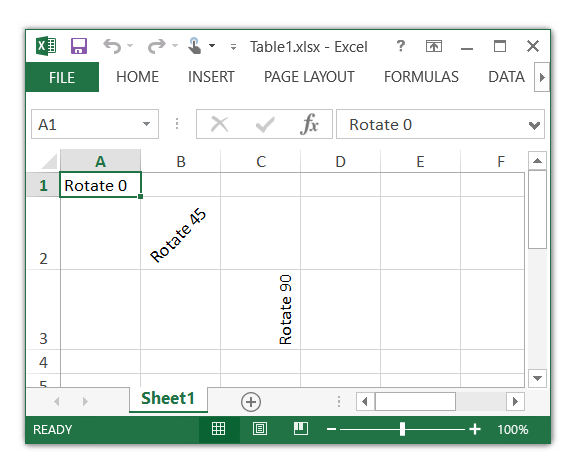
Example 6: Rotating expressions
Sometimes, it is easier to show labels in a table by rotating them. I can rotate an expression using the txtrotate() option.
. putexcel set Table1.xlsx, sheet(Sheet1) replace
Note: file will be replaced when the first putexcel command is issued

. putexcel A1 = "Rotate 0", txtrotate(0)
file Table1.xlsx saved

. putexcel B2 = "Rotate 45", txtrotate(45)
file Table1.xlsx saved

. putexcel C3 = "Rotate 90", txtrotate(90)
file Table1.xlsx saved
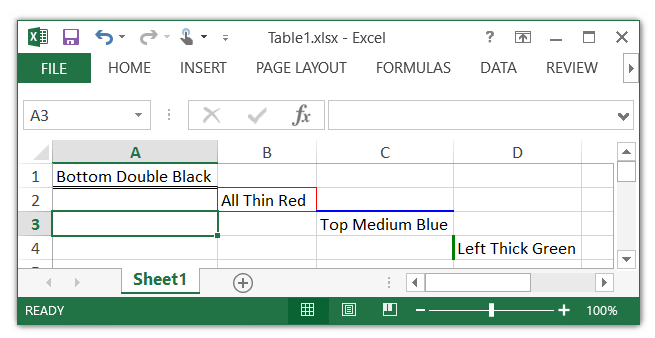
Example 7: Specifying the border location, style, and color
Cell borders and shading can be used to create an overall look to a table. I can use the border() option to add borders to individual cells.
. putexcel set Table1.xlsx, sheet(Sheet1) replace
Note: file will be replaced when the first putexcel command is issued

. putexcel A1 = "Bottom Double Black", border(bottom, double, black)
file Table1.xlsx saved

. putexcel B2 = "All Thin Red", border(all, thin, red)
file Table1.xlsx saved

. putexcel C3 = "Top Medium Blue ", border(top, medium, blue)
file Table1.xlsx saved

. putexcel D4 = "Left Thick Green", border(left, thick, green)
file Table1.xlsx saved
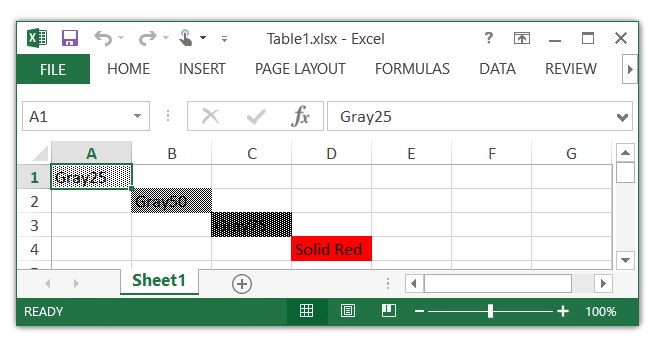
Example 8: Specifying the fill pattern for cells
And I can use the fpattern option to shade individual cells.
. putexcel set Table1.xlsx, sheet(Sheet1) replace
Note: file will be replaced when the first putexcel command is issued

. putexcel A1 = "Gray25", fpattern(gray25)
file Table1.xlsx saved

. putexcel B2 = "Gray50", fpattern(gray50)
file Table1.xlsx saved

. putexcel C3 = "Gray75", fpattern(gray75)
file Table1.xlsx saved

. putexcel D4 = "Solid Red", fpattern(solid, red)
file Table1.xlsx saved
Example 9: Merging cells
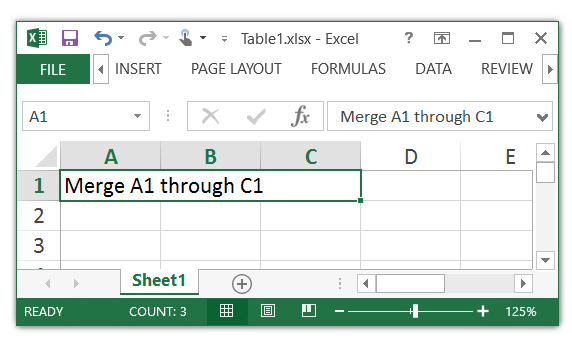
I might like to merge cells to create a title for several columns.
. putexcel set Table1.xlsx, sheet(Sheet1) replace
Note: file will be replaced when the first putexcel command is issued

. putexcel A1:C1 = "Merge A1 through C1", merge
file Table1.xlsx saved
Example 10: Combining options
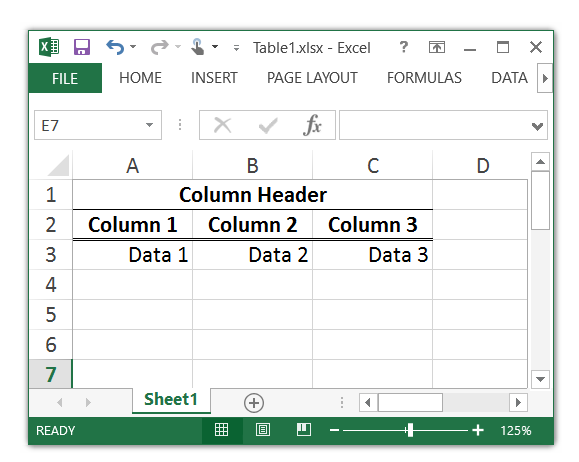
These formatting options can be combined to customize the layout of my table. For example, I might wish to create a column header by merging several cells, create column titles with a double border on the bottom of each cell, and add some data to my table.
. putexcel set Table1.xlsx, sheet(Sheet1) replace
Note: file will be replaced when the first putexcel command is issued

. putexcel A1:C1 = "Column Header", merge hcenter bold border(bottom)
file Table1.xlsx saved

. putexcel A2 = "Column 1", hcenter bold border(bottom, double)
file Table1.xlsx saved

. putexcel B2 = "Column 2", hcenter bold border(bottom, double)
file Table1.xlsx saved

. putexcel C2 = "Column 3", hcenter bold border(bottom, double)
file Table1.xlsx saved

. putexcel A3 = "Data 1", right
file Table1.xlsx saved

. putexcel B3 = "Data 2", right
file Table1.xlsx saved

. putexcel C3 = "Data 3", right
file Table1.xlsx saved
These are some of the formatting options that you can specify with putexcel. You can find a complete list of formatting options in the [P] putexcel entry in the Stata Programming Reference Manual.
Next time, I will focus on writing different kinds of expressions to Excel.