Creating Excel tables with putexcel, part 2: Macro, picture, matrix, and formula expressions
In my last post, I showed how to use putexcel to write simple expressions to Microsoft Excel and format the resulting text and cells. Today, I want to show you how to write more complex expressions such as macros, graphs, and matrices. I will even show you how to write formulas to Excel to create calculated cells. These are important steps toward our goal of automating the creation of reports in Excel.
Before we begin the examples, I want to point out that I am going to create a single Excel file called putexcel2.xlsx and write each example to a separate sheet within that file. So the putexcel set commands will look like this:
putexcel set putexcel2.xlsx, sheet(example1) replace
putexcel set putexcel2.xlsx, sheet(example2) modify
...
putexcel set putexcel2.xlsx, sheet(example8) modify
I could create a separate Excel file for each example, but I would prefer to have a single file with multiple sheets. You may wish to use a similar approach when creating large reports.
You can download the dataset used in the examples by typing webuse nhanes2. I am using a subset of the data and have relabeled some of the variables so don’t be concerned if your numbers don’t match mine exactly.
Example 1: Writing returned results to Excel
Many Stata commands return scalars, macros, and matrices. We can write each of these to an Excel table using putexcel. For example, I might wish to write the mean of age to Excel. I can type return list after summarize age to see a list of returned results. The mean is stored in the scalar r(mean).
. summarize age

    Variable |        Obs        Mean    Std. Dev.       Min        Max
-------------+---------------------------------------------------------
         age |      1,266    48.44076    16.98858         20         74

. return list

scalars:
                  r(N) =  1266
              r(sum_w) =  1266
               r(mean) =  48.44075829383886
                r(Var) =  288.6119026656426
                 r(sd) =  16.98858153777539
                r(min) =  20
                r(max) =  74
                r(sum) =  61326
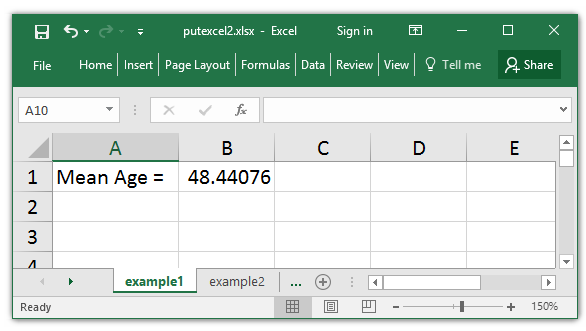
I begin by setting the destination to the sheet “example1” in the file putexcel2.xlxs. I can then write the expression “Mean Age = ” to cell A1 and the expression `r(mean)’ to cell B1. Note that r(mean) is enclosed in single quotes. This tells Stata that I want to write the value of r(mean) to cell B2.
. putexcel set putexcel2.xlsx, sheet(example1) replace
Note: file will be replaced when the first putexcel command is issued

. putexcel A1 = "Mean Age = "
file putexcel2.xlsx saved

. putexcel B1 = `r(mean)'
file putexcel2.xlsx saved
I can open the resulting Excel file and see that the mean was successfully written to cell B2.
Example 2: Formatting numbers with Excel formats
I can specify the display format of a number using Excel formats in the nformat() option. For example, I could display the mean with three decimal places using the option nformat(“#.###”).
. putexcel set putexcel2.xlsx, sheet(example2) modify

. putexcel A1 = "Mean Age = "
file putexcel2.xlsx saved

. putexcel B1 = `r(mean)', nformat("#.###")
file putexcel2.xlsx saved
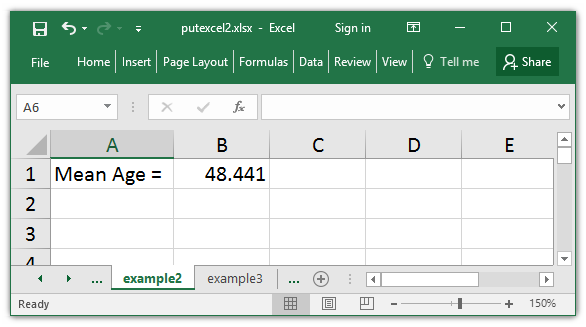
You can view a complete description of Excel’s formatting options in the Options section of [P] putexcel advanced.
Example 3: Formatting numbers with Stata formats
Stata includes many shortcut format codes that can be used with nformat(). For example, I could display the mean with two decimal places using the option number_d2.
. putexcel set putexcel2.xlsx, sheet(example3) modify

. putexcel A1 = "Mean Age = "
file putexcel2.xlsx saved

. putexcel B1 = `r(mean)', nformat(number_d2)
file putexcel2.xlsx saved
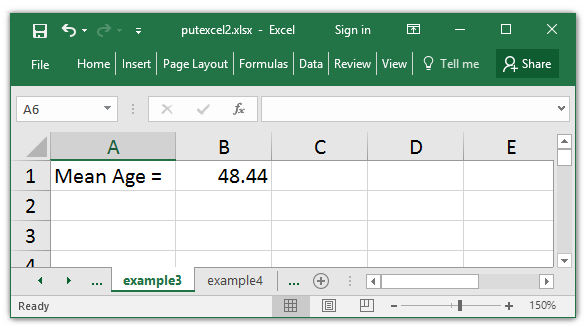
You can view a complete list of codes for numeric formats in the Appendix of [P] putexcel.
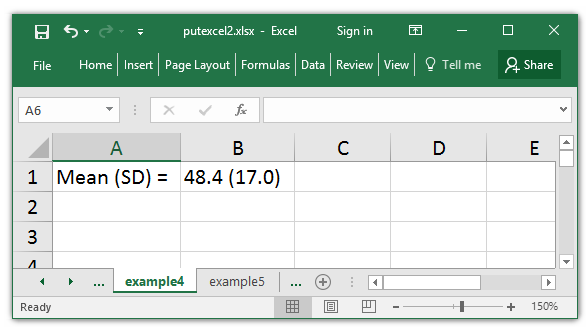
Example 4: Formatting numbers with the string() function
I could also report the mean and standard deviation in a single cell. This can be accomplished in two steps. First, I store r(mean) and r(sd) to the local macros meanage and sdage, respectively. The string() function allows me to specify one decimal place. Second, I create a local macro named meansd that combines meanage and sdage into a single expression. Note that I must use double quotes in the command putexcel B1 = “`meansd'” because meansd is a string.
. // put the mean of age in a cell using the string() function
. putexcel set putexcel2.xlsx, sheet(example4) modify

. putexcel A1 = "Mean (SD) = "
file putexcel2.xlsx saved

. local meanage = string(`r(mean)',"%9.1f")

. local sdage = string(`r(sd)',"%9.1f")

. local meansd = "`meanage' (`sdage')"

. putexcel B1 = "`meansd'"
file putexcel2.xlsx saved
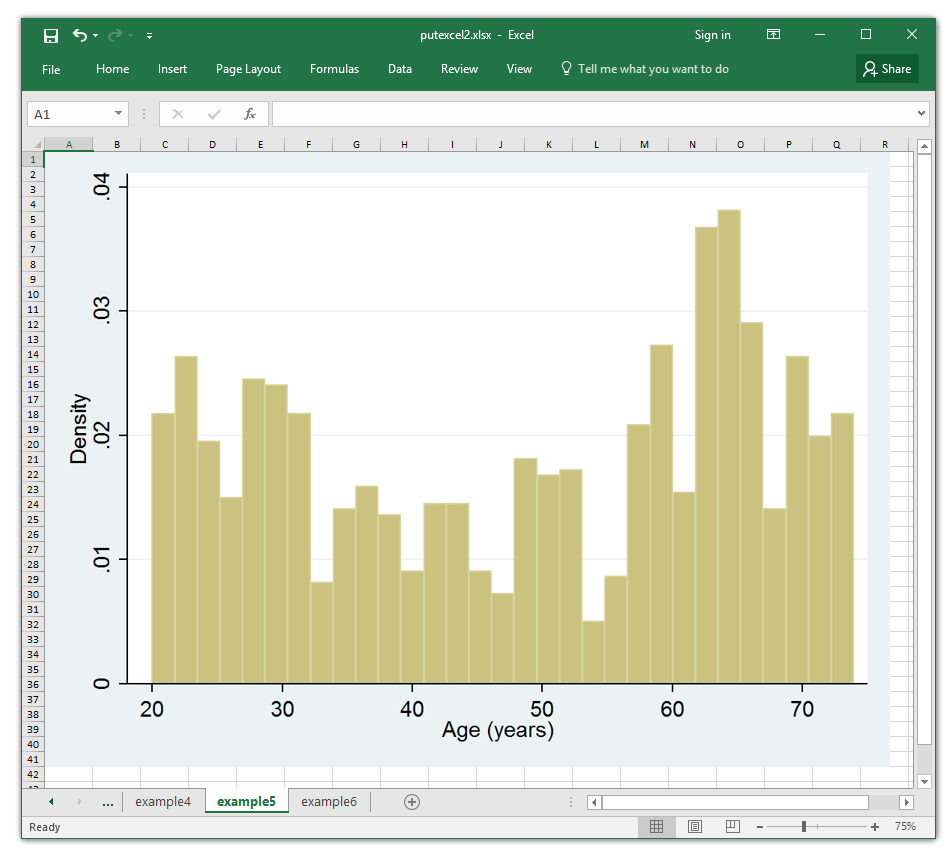
Example 5: Adding a graph to an Excel file
I might wish to include a histogram of age in my Excel file. First, I create the histogram and use graph export to save the graph to a .png file.
. histogram age
(bin=31, start=20, width=1.7419355)
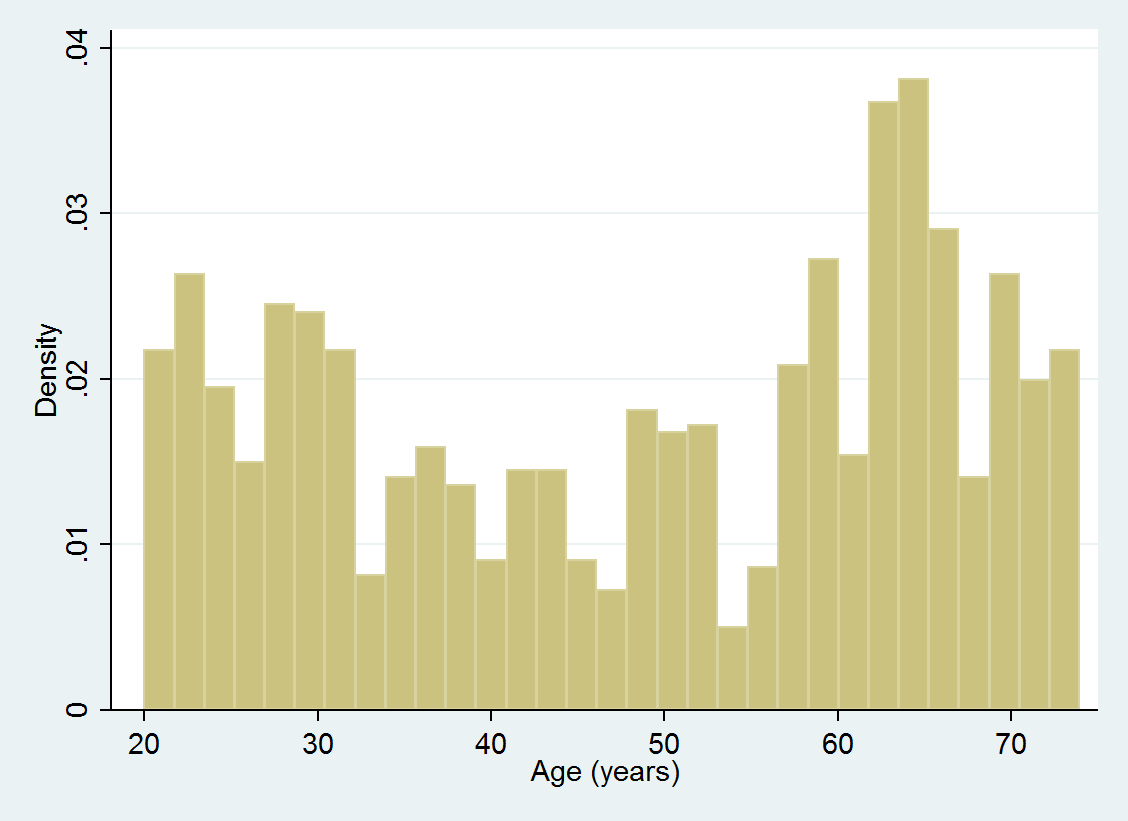
. graph export age.png, replace
(file age.png written in PNG format)
Then, I can put the graph in the spreadsheet using the expression picture(age.png)
. putexcel set putexcel2.xlsx, sheet(example5) modify

. putexcel A1 = picture(age.png)
file putexcel2.xlsx saved
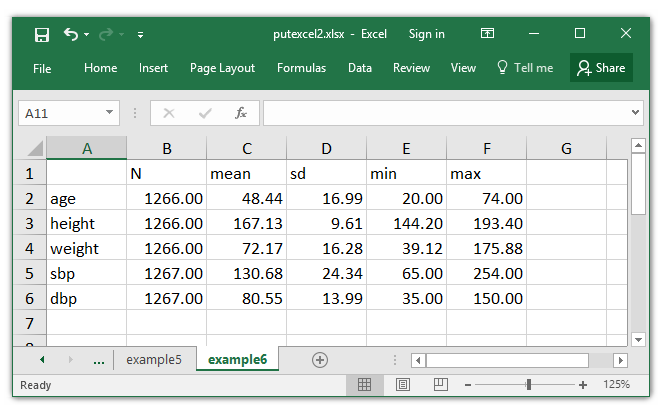
Example 6: Writing a matrix to Excel
Some Stata commands return matrices. For example, I can use tabstat to calculate descriptive statistics for a list of variables. The save option tells tabstat to save the results to a matrix.
. tabstat age height weight sbp dbp, stat(n mean sd min max) save

   stats |       age    height    weight       sbp       dbp
---------+--------------------------------------------------
       N |      1266      1266      1266      1267      1267
    mean |  48.44076  167.1308  72.17252  130.6843  80.54854
      sd |  16.98858   9.61487  16.28185  24.34302  13.99187
     min |        20   144.199     39.12        65        35
     max |        74   193.398    175.88       254       150
------------------------------------------------------------
When I type return list, I see that tabstat returned the matrix r(StatTotal).
. return list

matrices:
          r(StatTotal) :  5 x 5

. matlist r(StatTotal)

             |       age     height     weight        sbp        dbp
-------------+-------------------------------------------------------
           N |      1266       1266       1266       1267       1267
        mean |  48.44076   167.1308   72.17252   130.6843   80.54854
          sd |  16.98858    9.61487   16.28185   24.34302   13.99187
         min |        20    144.199      39.12         65         35
         max |        74    193.398     175.88        254        150
I would prefer to create an Excel table that looks like the output from summarize with variables in rows and statistics in columns. So I create a matrix called results, which is equal to the transpose of r(StatTotal).
. matrix results = r(StatTotal)'

. matlist results

             |         N       mean         sd        min        max
-------------+-------------------------------------------------------
         age |      1266   48.44076   16.98858         20         74
      height |      1266   167.1308    9.61487    144.199    193.398
      weight |      1266   72.17252   16.28185      39.12     175.88
         sbp |      1267   130.6843   24.34302         65        254
         dbp |      1267   80.54854   13.99187         35        150
Then, I write the matrix results to Excel using the expression matrix(results). I could use the expression matrix(r(StatTotal)’) rather than creating a new matrix, but I wanted to show you the transposed matrix before writing it to Excel. The upper-left corner of the matrix will be placed in cell A1 of the Excel table. The names option tells putexcel to write the row and column names to Excel along with the matrix. The nformat(number_d2) option tells putexcel to display the matrix with two decimal places.
. putexcel set putexcel2.xlsx, sheet(example6) modify

. putexcel A1 = matrix(results), names nformat(number_d2)
file putexcel2.xlsx saved
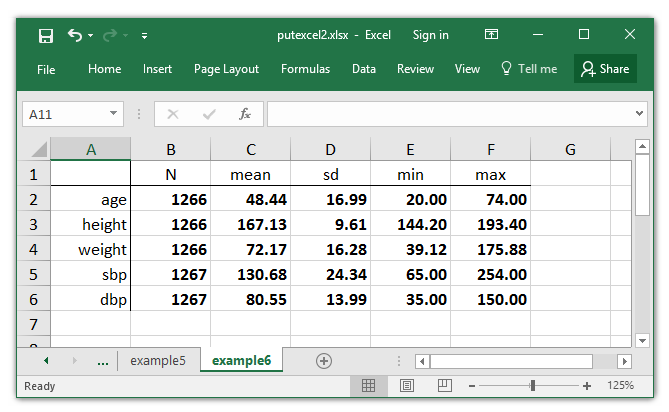
Next, I would like to format the Excel table to make it look more like a table of results rather than a matrix. I can change the format of a cell without writing anything to the cell. I can even format a range of cells using the syntax ul:br, where ul is the upper-left corner of the cell range and br is the bottom-right cell.
The sample sizes for each variable displayed in cells B2:B6 do not need two decimal places. I can display cells B2:B6 with no decimals using the nformat(number) option. The option overwritefmt tells putexcel to overwrite the existing cell format.
. putexcel B2:B6, nformat(number) overwritefmt
file putexcel2.xlsx saved
Next, I format the cells A1:A6. The right option aligns the text to the right side of the cells, and the border(right) option adds a border to the right side of the cells.
. putexcel A1:A6, right border(right) overwritefmt
file putexcel2.xlsx saved
I format cells A1:F1 similarly. The hcenter option centers the labels horizontally, and the border(bottom) option adds a border to the bottom of cells A1:F1.
. putexcel A1:F1, hcenter bold border(bottom) overwritefmt
file putexcel2.xlsx saved
Finally, I display the numbers in cells B2:F1 using a bold font to make the table look similar to the output of summarize.
. putexcel B2:F6, bold
file putexcel2.xlsx saved
The formatted Excel table looks like this:
Example 7: Writing regression coefficients to Excel
Most Stata regression commands return the table of coefficients in a matrix named r(table). For example, I could fit the following linear regression model with regress.
. regress sbp age sex

      Source |       SS           df       MS      Number of obs   =     1,266
-------------+----------------------------------   F(2, 1263)      =    236.23
       Model |  204030.521         2  102015.261   Prob > F        =    0.0000
    Residual |  545432.459     1,263  431.854678   R-squared       =    0.2722
-------------+----------------------------------   Adj R-squared   =    0.2711
       Total |   749462.98     1,265  592.460854   Root MSE        =    20.781

------------------------------------------------------------------------------
         sbp |      Coef.   Std. Err.      t    P>|t|     [95% Conf. Interval]
-------------+----------------------------------------------------------------
         age |   .7328247   .0343946    21.31   0.000     .6653479    .8003014
         sex |   5.292591   1.170872     4.52   0.000     2.995522     7.58966
       _cons |    92.6976   1.852992    50.03   0.000     89.06232    96.33289
------------------------------------------------------------------------------
and type matlist r(table) to see the coefficient matrix.
. matlist r(table)

             |       age        sex      _cons
-------------+---------------------------------
           b |  .7328247   5.292591    92.6976
          se |  .0343946   1.170872   1.852992
           t |  21.30641   4.520211   50.02589
      pvalue |  2.65e-86   6.76e-06   6.9e-302
          ll |  .6653479   2.995522   89.06232
          ul |  .8003014    7.58966   96.33289
          df |      1263       1263       1263
        crit |  1.961844   1.961844   1.961844
       eform |         0          0          0
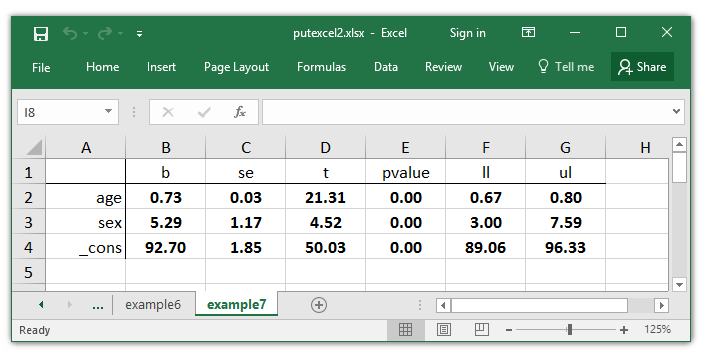
r(table) contains the rows df, crit, and eform, which are not displayed in the regression output. I would like to reproduce the table of coefficients in my Excel table, so I store r(table) to the matrix results, extract the first six rows of results, and then transpose results.
. matrix results = r(table)

. matrix results = results[1..6,1...]'

. matlist results

             |         b         se          t     pvalue         ll         ul
-------------+------------------------------------------------------------------
         age |  .7328247   .0343946   21.30641   2.65e-86   .6653479   .8003014
         sex |  5.292591   1.170872   4.520211   6.76e-06   2.995522    7.58966
       _cons |   92.6976   1.852992   50.02589   6.9e-302   89.06232   96.33289
Now, I can write results to my Excel file.
. putexcel set putexcel2.xlsx, sheet(example8) modify

. putexcel A1 = matrix(results), names nformat(number_d2) hcenter
file putexcel2.xlsx saved
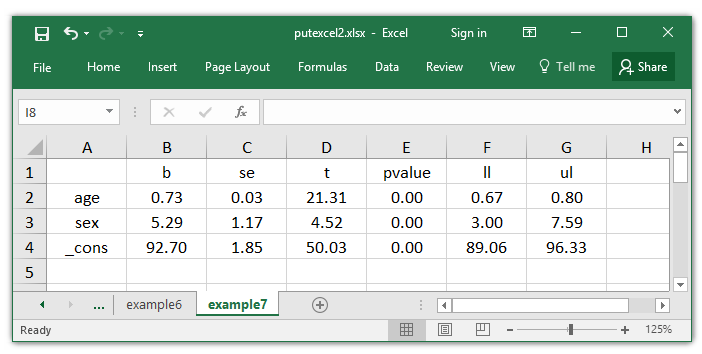
A few adjustments to the font and cell formats make my matrix look more like a table of coefficients.
. putexcel B2:G4, bold overwritefmt
file putexcel2.xlsx saved

. putexcel A1:A4, right border(right) overwritefmt
file putexcel2.xlsx saved

. putexcel A1:G1, hcenter border(bottom) overwritefmt
file putexcel2.xlsx saved
Example 8: Writing cross-tabulations to Excel
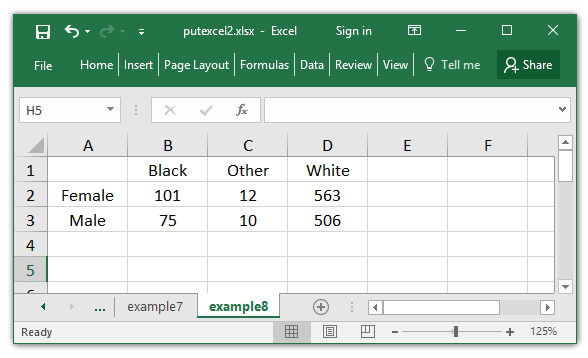
We can also write the results from tabulate to Excel using matrices. The matcell() option stores the cell counts from tabulate in a matrix. For example, I can store the results of the tabulate command below in the matrix cellcounts.
. tabulate sex race, matcell(cellcounts)

           |               Race
       Sex |     Black      Other      White |     Total
-----------+---------------------------------+----------
    Female |       101         12        563 |       676
      Male |        75         10        506 |       591
-----------+---------------------------------+----------
     Total |       176         22      1,069 |     1,267


. matlist cellcounts

             |        c1         c2         c3
-------------+---------------------------------
          r1 |       101         12        563
          r2 |        75         10        506
I can rename the rows of cellcounts with the value labels from sex using the following steps. First, sex is stored as a numeric variable, so I can use decode to create a string variable called sex_s. I could omit this step if sex was stored as a string variable. Next, I use levelsof to store the levels of sex_s to the local macro sexlabels. Then, I use matrix rownames to label the rows of cellcounts with the labels stored sexlabels.
. decode sex, generate(sex_s)

. levelsof sex_s, local(sexlabels)
`"Female"' `"Male"'

. matrix rownames cellcounts = `sexlabels'

. matlist cellcounts

             |        c1         c2         c3
-------------+---------------------------------
      Female |       101         12        563
        Male |        75         10        506
I can use the same steps to rename the columns of cellcounts with the value labels of race.
. decode race, generate(race_s)

. levelsof race_s, local(racelabels)
`"Black"' `"Other"' `"White"'

. matrix colnames cellcounts = `racelabels'

. matlist cellcounts

             |     Black      Other      White
-------------+---------------------------------
      Female |       101         12        563
        Male |        75         10        506
I can then write cellcounts to Excel just like I did in the last two examples.
. putexcel set putexcel2.xlsx, sheet(example9) modify

. putexcel A1 = matrix(cellcounts), names hcenter
file putexcel2.xlsx saved
This approach worked, but there are no row and column totals in my Excel table. One way to add them is to put calculated cells in the table using formula() expressions. For example, the first line of putexcel below puts the Excel function SUM(B2:D2) in cell E2. This calculates the total for the first row of the table. The putexcel command below puts formulas in the table to calculate the row, column, and overall totals.
. putexcel E2 = formula(=SUM(B2:D2))      ///
>          E3 = formula(=SUM(B3:D3))      ///
>          B4 = formula(=SUM(B2:B3))      ///
>          C4 = formula(=SUM(C2:C3))      ///
>          D4 = formula(=SUM(D2:D3))      ///
>          E4 = formula(=SUM(B2:D3)), hcenter
file putexcel2.xlsx saved

I can visually differentiate the row and column totals from the cells by adding labels and borders. I can also display the numbers with a bold font.
. putexcel A4 = "Total" E1 = "Total", hcenter
file putexcel2.xlsx saved

. putexcel A1:A4 D1:D4, border(right) overwritefmt
file putexcel2.xlsx saved

. putexcel A1:E1 A3:E3, border(bottom) overwritefmt
file putexcel2.xlsx saved

. putexcel B2:E4, bold
file putexcel2.xlsx saved
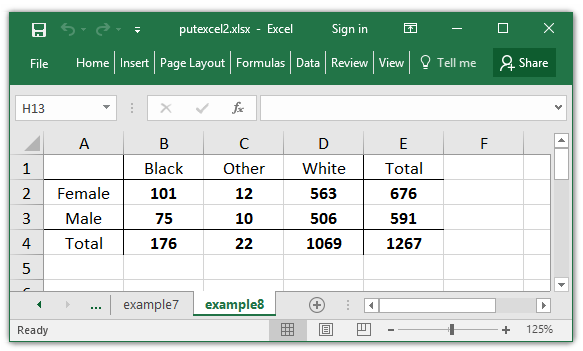
The Excel table looks similar to the output from tabulate.
Re-creating Stata output in Excel tables is easy with putexcel using returned scalars, macros, and matrices. Examples 1-7 generalize well for arbitrary variables, but I hardcoded the row and column totals for the variables sex and race in example 8.
Next time, I will show you how to generalize these examples for arbitrary variables and put more eleborate expressions in the table cells.