Update on the Stata YouTube Channel
What is it about round numbers that compels us to pause and reflect? We celebrate 20-year school reunions, 25-year wedding anniversaries, 50th birthdays and other similar milestones. I don’t know the answer but the Stata YouTube Channel recently passed several milestones – more than 1500 subscribers, over 50,000 video views and it was launched six months ago. We felt the need for a small celebration to mark the occasion, and I thought that I would give you a brief update.
I could tell you about re-recording the original 24 videos with a larger font to make them easier to read. I could tell you about the hardware and software that we use to record them including our experiments with various condenser and dynamic microphones. I could share quotes from some of the nice messages we’ve received. But I think it would be more fun to talk about….you!
YouTube collects data about the number of views each video receives as well as summary data about who, what, when, where, and how you are watching them. There is no need to be concerned about your privacy; there are no personal identifiers of any kind associated with these data. But the summary data are interesting, and I thought it might be fun to share some of the data with you.
Who’s watching?
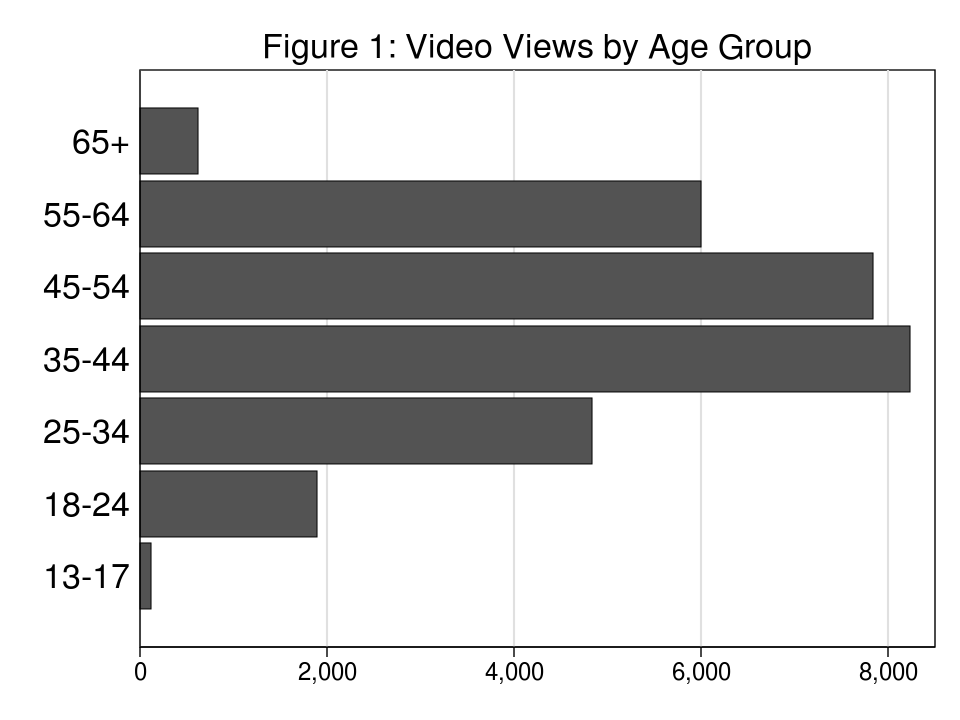
Figure 1 shows the age distribution of Stata YouTube Channel viewers. If you have ever attended a Stata Conference, you will not be surprised by this graph…until you notice the age group at the bottom. I would not have guessed that 13-17 year olds are watching our videos. Perhaps they saw Stata in the movie “Moneyball” with Brad Pitt and wanted to learn more. Or maybe they were influenced by the latest fashion craze sweeping the youth of the world.
What are you watching?
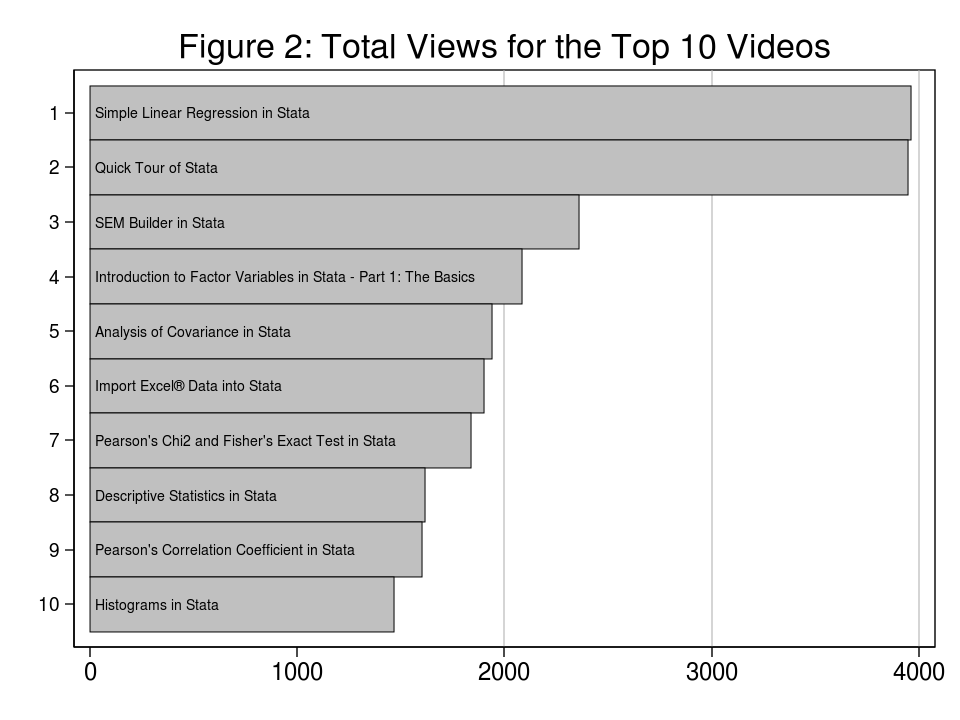
We have posted more than 50 videos over a wide range of topics. Figure 2 shows the total number of views for the ten most popular videos. The more popular of the ten are about broad topics. These broader videos are mostly older and have thus had time to accumulate more views.
Even so, these videos receive more views per day currently than do the special topic videos that have been posted more recently. This supports my belief that Stata YouTube Channel viewers tend to be relatively new Stata users who want to learn about general topics, and that means more generic videos in the future. So you and your two post-docs will just have to read the manual if you want to learn how to fit asymmetric power ARCH models with outer-product gradient standard errors.
When are you watching?
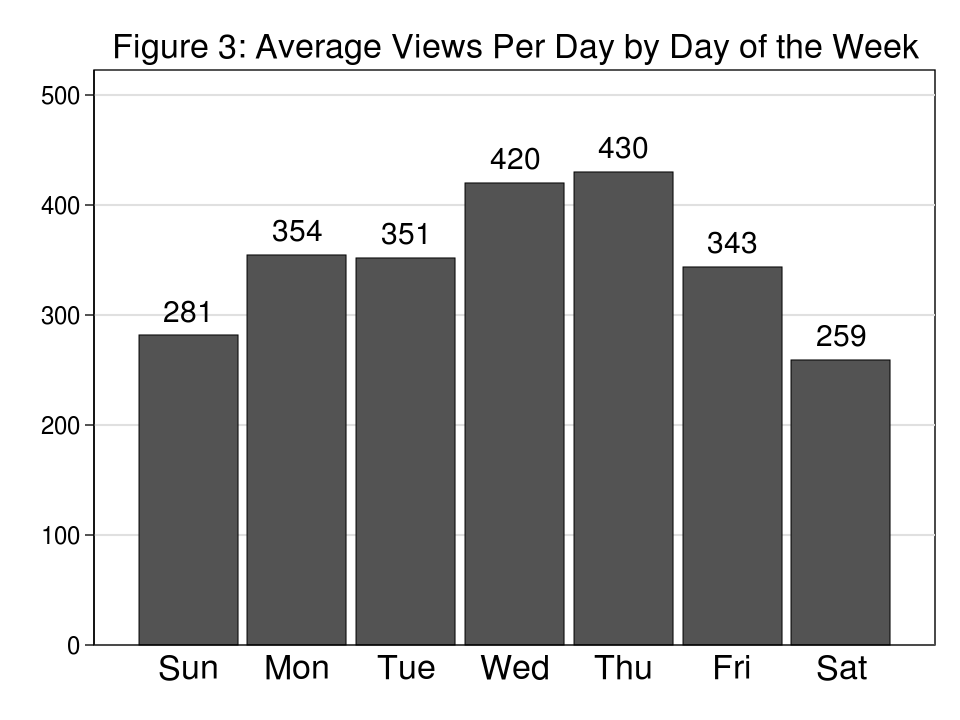
We usually post new videos on Tuesday mornings which might lead you to believe that the peak viewing day would also be Tuesday. Figure 3, however, shows us that the average number of views per day (vpd) is higher on Wednesdays at 420 vpd and in fact peaks on Thursdays at 430 vpd before declining Friday through Sunday.
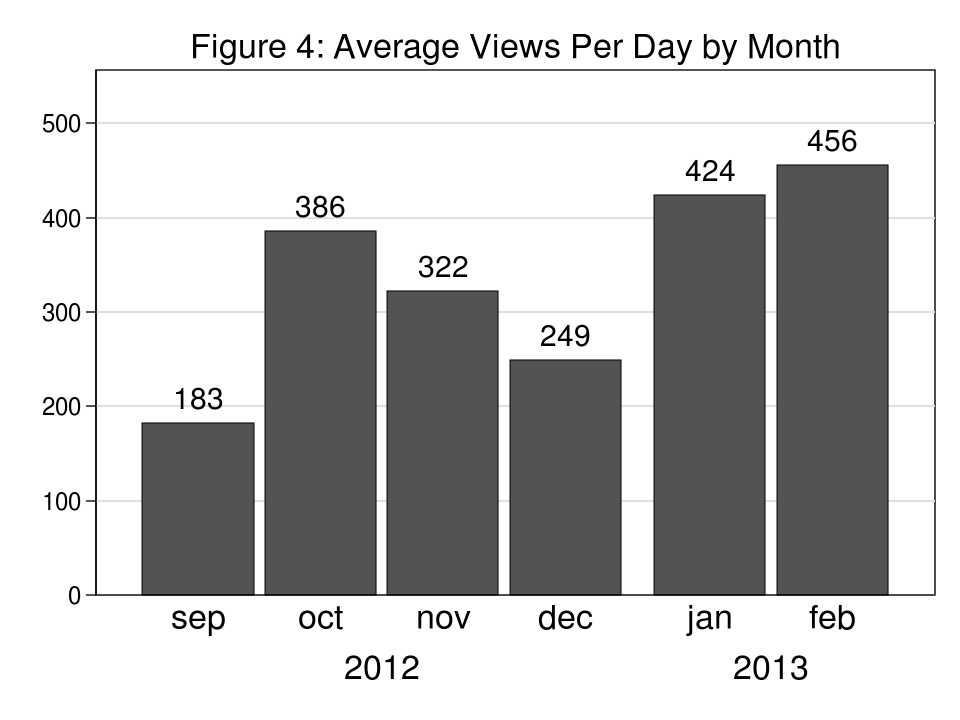
Figure 4 also shows us that late September may have been not the best time to launch the Stata YouTube Channel. Our early momentum in September and October slowed during the November and December holiday seasons. We were, however, pleased to see that 49 of you spent New Years Eve watching our videos. Perhaps next year we’ll prepare something more festive just for you!
Where are you watching?
What do the Czech Republic, Pakistan, Uganda, Madagascar, the United Kingdom, the Bahamas, the United States, Montenegro, and Italy have in common? Correct! They are all countries in which you are watching our videos. They are also locations depicted in one of my favorite action films but I’ll leave that to the trivia buffs. I think the most exciting information that we found in our data is that the Stata YouTube Channel is being viewed in 164 countries!
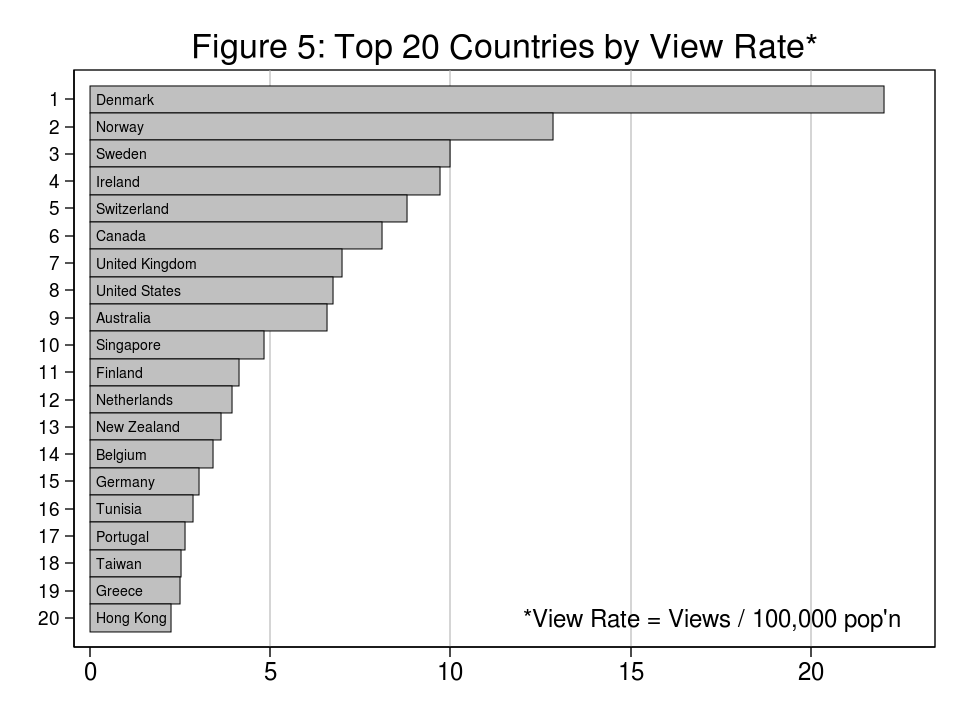
You might not be surprised to learn that roughly half of the people watching the videos live in the United States, the United Kingdom, or Canada. The results may be unexpected when we consider the “view rate” defined as the number of views per 100,000 residents. Figure 5 shows the top 20 countries ranked by view rate for countries with at least four million residents. Denmark had the highest view rate which was nearly twice the rate of Norway which had the second highest view rate. The view rate in Denmark was more than three times the rate in the US and the UK.
How are you watching?
You might think that I would have anything to report about “how” you are watching the videos, but it turns out that 5.2% of you are watching on mobile devices. Perhaps this explains the 13-17 year old demographic or the 49 people watching on New Year’s Eve. Or maybe we are helping you pass the time in the dentist office waiting room.
Final thoughts
Six months isn’t much of a milestone. We Stata folk will use any excuse to break out the cake and ice cream. Even so, the Stata YouTube Channel began as an experiment and often experiments do not work out as we would like. This experiment has exceeded our expectations and, as a result, we have started taking requests for videos on our Facebook page and we’ll be adding more videos every week. So thanks for watching and stay tuned!
Now if you will excuse me, I’m going to get some cake and ice cream.