Creating Excel tables with putexcel part 3: Writing custom reports for arbitrary variables
In my last post, I demonstrated how to use putexcel to recreate common Stata output in Microsoft Excel. Today I want to show you how to create custom reports for arbitrary variables. I am going to create tables that combine cell counts with row percentages, and means with standard deviations. But you could modify the examples below to include column percentages, percentiles, standard errors, confidence intervals or any statistic. I am also going to pass the variable names into my programs using local macros. This will allow me to create the same report for arbitrary variables by simply assigning new variable names to the macros. You could extend this idea by creating a do-file for each report and passing the variable names into the do-files. This is another important step toward our goal of automating the creation of reports in Excel.
Today’s blog post is lengthy and contains several large code blocks. This is because each example contains the code from the previous example along with new lines of code. This allows you to see the new code in the context of the overall program but it also makes the post appear longer than it is. Most of the code in the code blocks is the same from example to example.
Example 1: Writing returned results to Excel
Let’s begin by using tabulate to create a matrix of cell counts for sex and race. I could type
tabulate sex race, matcell(cellcounts)
but I would like the ability to tabulate any two categorical variables. So I first store sex in the local macro RowVar and the race in the local macro ColVar. Now I can tabulate sex and race using their corresponding local macros.
. local RowVar = "sex"

. local ColVar = "race"

. tabulate `RowVar' `ColVar', matcell(cellcounts)

           |               Race
       Sex |     Black      Other      White |     Total
-----------+---------------------------------+----------
    Female |       101         12        563 |       676
      Male |        75         10        506 |       591
-----------+---------------------------------+----------
     Total |       176         22      1,069 |     1,267
The cell counts are stored in the matrix cellcounts.
. matrix list cellcounts

cellcounts[2,3]
     c1   c2   c3
r1  101   12  563
r2   75   10  506
I can type return list to see a list of scalars returned by tabulate. The total number of observations is stored in the scalar r(N), the number of rows is stored in r(r), and the number of columns is stored in r(c).
. return list

scalars:
                  r(N) =  1267
                  r(r) =  2
                  r(c) =  3
I can store these scalars in local macros so that I can use them later.
. local TotalCount = r(N)

. local RowCount = r(r)

. local ColCount = r(c)
Example 2: Looping over rows and columns
I can use the stored row and column counts to loop over each cell of the matrix cellcounts.
. forvalues row = 1/`RowCount' {
         forvalues col = 1/`ColCount' {
                 local cellcount = cellcounts[`row',`col']
                 display "cellcounts[`row',`col'] = `cellcount'"
         }
}
cellcounts[1,1] = 101
cellcounts[1,2] = 12
cellcounts[1,3] = 563
cellcounts[2,1] = 75
cellcounts[2,2] = 10
cellcounts[2,3] = 506
Looping over each cell in the matrix allows us to format the number in each cell and/or use the number to calculate another quantity such as a percentage.
Example 3: The char() function
The rows and columns of matrices are indexed with numbers. The rows of Excel tables are indexed with numbers but the columns are indexed with letters. I can translate the column number of a matrix to a column letter in Excel using the char() function. The argument of the char() function is an ASCII number and the function returns the corresponding ASCII letter. For example, char(65) returns the letter “A”, char(66) returns the letter “B”, and so forth.
. display char(65)
A

. display char(66)
B

. display char(67)
C
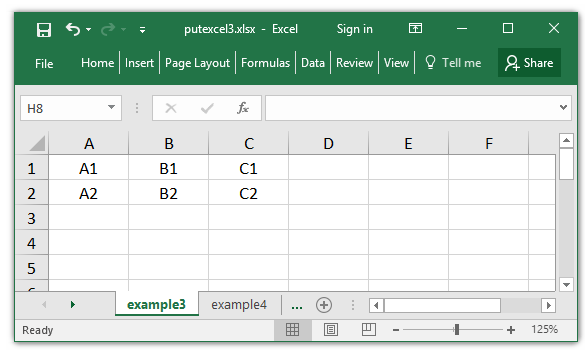
I can use the function char(64 + `col’) in my loop to translate the column number of the matrix to the column letter of the Excel table. Line 4 in Code block 1 below stores the cell name to the local macro Cell. I could have used “`row'” in line 4 rather than string(`row’). But I will eventually need the string() function so I am using it here for consistency. Line 5 then uses putexcel to write the value of Cell to the corresponding cell in Excel.
putexcel set putexcel3.xlsx, sheet(example3) replace
forvalues row = 1/`RowCount' {
    forvalues col = 1/`ColCount' {
	local Cell = char(64 + `col') + string(`row')
	putexcel `Cell' = "`Cell'", hcenter
    }
}
Example 4: Writing cell counts to Excel
Code block 2 demonstrates how to write the cell counts from the matrix to the Excel table. Line 4 of Code block 2 stores the cell count from the matrix cellcounts to the local macro CellContents, Line 5 stores the destination cell in the Excel table to the local macro Cell, and Line 6 uses putexcel to write CellContents to Cell in the Excel table.
putexcel set putexcel3.xlsx, sheet(example4) modify
forvalues row = 1/`RowCount' {
    forvalues col = 1/`ColCount' {
	local CellContents = cellcounts[`row',`col']
	local Cell = char(64 + `col') + string(`row')
	putexcel `Cell' = "`CellContents'", hcenter
    }
}

Example 5: Writing row percentages to Excel
I might wish to write the row percentages to the Excel table rather than the cell counts. I will need both the cell counts and the row totals to calculate the row percentages. The tabulate command in Line 3 of Code block 3 below stores the row totals to the vector rowtotals. Line 11 stores the cell counts to the local macro cellcount. Line 12 calculates and formats the cell percentage and stores it to the local macro cellpercent. Line 13 adds the “%” symbol to cellpercent and stores the resulting string to the local macro CellContents.
local RowVar = "sex"
local ColVar = "race"
tabulate `RowVar' if !missing(`ColVar'), matcell(rowtotals)
tabulate `RowVar' `ColVar', matcell(cellcounts)
local RowCount = r(r)
local ColCount = r(c)

putexcel set putexcel3.xlsx, sheet(example5) modify
forvalues row = 1/`RowCount' {
    forvalues col = 1/`ColCount' {
	local cellcount = cellcounts[`row',`col']
	local cellpercent = string(100*`cellcount'/rowtotals[`row',1],"%9.1f")
	local CellContents = "`cellpercent'%"
	local Cell = char(64 + `col') + string(`row')
	putexcel `Cell' = "`CellContents'", right
    }
}

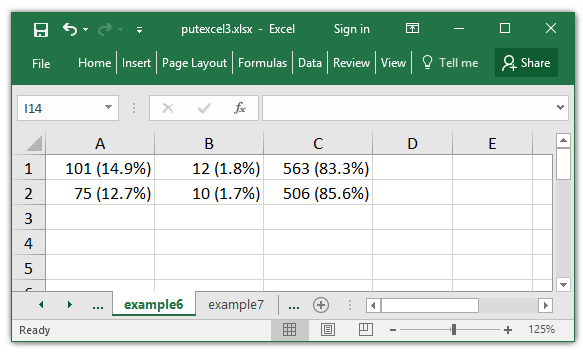
Example 6: Writing cell counts and row percentages to Excel
I could write both the cell count and the row percentage to each cell. I can do this by modifying Line 13 from Code block 3 above. Line 13 in Code block 4 below stores both cellcount and cellpercent to the local macro CellContents.
local RowVar = "sex"
local ColVar = "race"
tabulate `RowVar' if !missing(`ColVar'), matcell(rowtotals)
tabulate `RowVar' `ColVar', matcell(cellcounts)
local RowCount = r(r)
local ColCount = r(c)

putexcel set putexcel3.xlsx, sheet(example6) modify
forvalues row = 1/`RowCount' {
    forvalues col = 1/`ColCount' {
	local cellcount = cellcounts[`row',`col']
	local cellpercent = string(100*`cellcount'/rowtotals[`row',1],"%9.1f")
	local CellContents = "`cellcount' (`cellpercent'%)"
	local Cell = char(64 + `col') + string(`row')
	putexcel `Cell' = "`CellContents'", right
    }
}
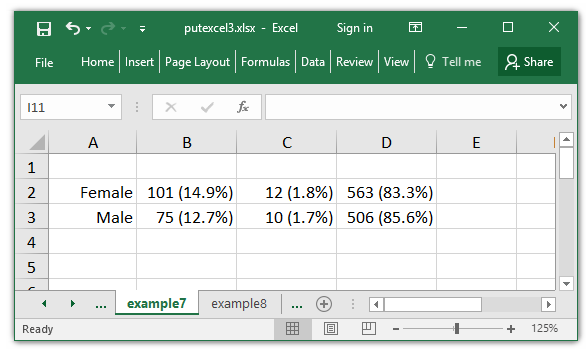
Example 7: Adding row labels to Excel tables
Next I would like to add row labels to my Excel table. I could type “Female” and “Male” in the Excel table but I would like to be able to change the row variable at the top of my program and label the rows automatically.
Value labels such as “0=Female” and “1=Male” are defined using label define and the labels are attached to a variable using label values. If I type describe sex, I can see that the value label attached to sex is named SexLabel.
. describe sex

              storage   display    value
variable name   type    format     label      variable label
------------------------------------------------------------------------------
sex             byte    %9.0g      SexLabel   Sex
And I can view the definition of SexLabel by typing label list SexLabel.
. label list SexLabel
SexLabel:
           0 Female
           1 Male
I can access all of the information about the value labels for a variable using only the variable name. The name of the current row variable, sex, is stored in the local macro RowVar. I can store the value label for RowVar to the local macro RowValueLabel using the macro list function below.
. local RowVar = "sex"

. local RowValueLabel : value label `RowVar'

. display "`RowValueLabel'"
SexLabel
I can use levelsof to store the numeric categories of RowVar to the local macro RowLevels.
. levelsof `RowVar', local(RowLevels)
0 1

. display "`RowLevels'"
0 1
I can refer to each of the numeric categories in RowLevels using the words() function. For example, the first “word” in the local macro RowLevels is “0”. I can store this “word” in the local macro RowValueLabelNum using the following macro list function.
. local RowValueLabelNum = word("`RowLevels'", 1)

. display "`RowValueLabelNum'"
0
I can then store the label associated with “0” to the local macro RowLabel using the following macro list function.
. local RowLabel : label `RowValueLabel' `RowValueLabelNum'

. display "`RowLabel'"
Female
I could use the same approach to store the second category of sex.
. local RowValueLabelNum = word("`RowLevels'", 2)

. display "`RowValueLabelNum'"
1

. local RowLabel : label `RowValueLabel' `RowValueLabelNum'

. display "`RowLabel'"
Male
Code block 5 below incorporates these commands to extract the value labels for RowVar and uses putexcel to write the labels to my Excel table.
I begin by moving the cells of my Excel table down one row and one column to the right. This will make room for the row labels, and the column labels I will add later. I shift the table down and right in lines 16 and 23 below by adding 1 to the arguments of the char() and string() functions.
Line 8 stores the value label of RowVar to the local macro RowValueLabel. Line 9 store the numeric categories of RowVar to the local macro RowLevels.
Lines 14-17 extract the label associated with each numeric category and writes it to my Excel table.
local RowVar = "sex"
local ColVar = "race"
tabulate `RowVar' if !missing(`ColVar'), matcell(rowtotals)
tabulate `RowVar' `ColVar', matcell(cellcounts)
local RowCount = r(r)
local ColCount = r(c)

local RowValueLabel : value label `RowVar'
levelsof `RowVar', local(RowLevels)

putexcel set putexcel3.xlsx, sheet(example7) modify
forvalues row = 1/`RowCount' {

    local RowValueLabelNum = word("`RowLevels'", `row')
    local CellContents : label `RowValueLabel' `RowValueLabelNum'
    local Cell = char(64 + 1) + string(`row'+1)
    putexcel `Cell' = "`CellContents'", right

    forvalues col = 1/`ColCount' {
	local cellcount = cellcounts[`row',`col']
	local cellpercent = string(100*`cellcount'/rowtotals[`row',1],"%9.1f")
	local CellContents = "`cellcount' (`cellpercent'%)"
	local Cell = char(64 + `col' + 1) + string(`row' + 1)
	putexcel `Cell' = "`CellContents'", right
    }
}
Example 8: Adding row totals to an Excel table
Next I would like to add row totals to my Excel table. I stored the row totals to the matrix rowtotals earlier so that I could calculate row percentages. So all I need to do write the values from that matrix to my Excel table.
Line 3 of Code block 6 below stores the row totals to the matrix rowtotals. Lines 19-21 extract the total for each row from rowtotals and writes it to the Excel table. Note that I am writing the row totals one column to the right of the Excel table by adding 2 to the argument of the char() function in line 20.
local RowVar = "sex"
local ColVar = "race"
tabulate `RowVar' if !missing(`ColVar'), matcell(rowtotals)
tabulate `RowVar' `ColVar', matcell(cellcounts)
local RowCount = r(r)
local ColCount = r(c)

levelsof `RowVar', local(RowLevels)
local RowValueLabel : value label `RowVar'

putexcel set putexcel3.xlsx, sheet(example8) modify
forvalues row = 1/`RowCount' {

    local RowValueLabelNum = word("`RowLevels'", `row')
    local CellContents : label `RowValueLabel' `RowValueLabelNum'
    local Cell = char(64 + 1) + string(`row'+1)
    putexcel `Cell' = "`CellContents'", right

    local CellContents = rowtotals[`row',1]
    local Cell = char(64 + `ColCount' + 2) + string(`row' + 1)
    putexcel `Cell' = "`CellContents'", hcenter

    forvalues col = 1/`ColCount' {
	local cellcount = cellcounts[`row',`col']
	local cellpercent = string(100*`cellcount'/rowtotals[`row',1],"%9.1f")
	local CellContents = "`cellcount' (`cellpercent'%)"
	local Cell = char(64 + `col' + 1) + string(`row' + 1)
	putexcel `Cell' = "`CellContents'", right
    }
}

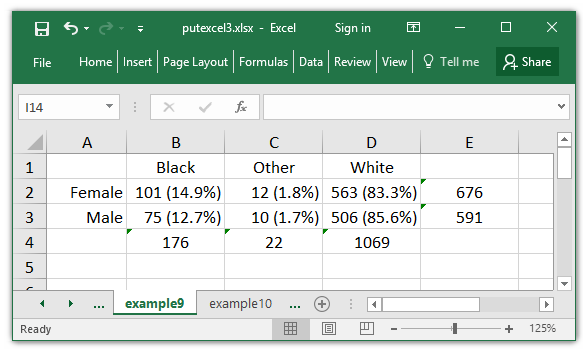
Example 9: Adding column labels and totals to an Excel table
I can add column labels and totals using the same strategy. I begin by saving the column totals to the matrix coltotals in line 4 of Code block 7 below. Line 12 stores the value label for ColVar to the local macro ColLevels and line 13 stores the numeric categories of ColVar to the local macro ColLevels.
Lines 34-43 write the value labels and column totals to the Excel spreadsheet. I only need to write the information to Excel one time so I have specified that these lines run only when the condition if `row’==1 is met.
local RowVar = "sex"
local ColVar = "race"
tabulate `RowVar' if !missing(`ColVar'), matcell(rowtotals)
tabulate `ColVar' if !missing(`RowVar'), matcell(coltotals)
tabulate `RowVar' `ColVar', matcell(cellcounts)
local RowCount = r(r)
local ColCount = r(c)

local RowValueLabel : value label `RowVar'
levelsof `RowVar', local(RowLevels)

local ColValueLabel : value label `ColVar'
levelsof `ColVar', local(ColLevels)

putexcel set putexcel3.xlsx, sheet(example9) modify
forvalues row = 1/`RowCount' {

    local RowValueLabelNum = word("`RowLevels'", `row')
    local CellContents : label `RowValueLabel' `RowValueLabelNum'
    local Cell = char(64 + 1) + string(`row'+1)
    putexcel `Cell' = "`CellContents'", right

    local CellContents = rowtotals[`row',1]
    local Cell = char(64 + `ColCount' + 2) + string(`row' + 1)
    putexcel `Cell' = "`CellContents'", hcenter

    forvalues col = 1/`ColCount' {
	local cellcount = cellcounts[`row',`col']
	local cellpercent = string(100*`cellcount'/rowtotals[`row',1],"%9.1f")
	local CellContents = "`cellcount' (`cellpercent'%)"
	local Cell = char(64 + `col' + 1) + string(`row' + 1)
	putexcel `Cell' = "`CellContents'", right

	if `row'==1 {
		local ColValueLabelNum = word("`ColLevels'", `col')
		local CellContents : label `ColValueLabel' `ColValueLabelNum'
		local Cell = char(64 + `col' + 1) + string(1)
		putexcel `Cell' = "`CellContents'", hcenter

		local CellContents = coltotals[`col',1]
		local Cell = char(64 + `col' + 1) + string(`RowCount' + 2)
		putexcel `Cell' = "`CellContents'", hcenter
	}
    }
}
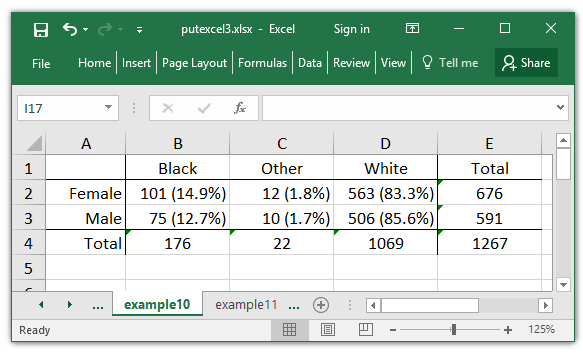
Example 10: Formating an Excel table
Now that I have all of the numbers and labels in my Excel table, I would like to add some lines to make it easier to read.
Lines 49-50 in Code block 8 below, write the total count to the bottom right corner of the table. Lines 52-53 label the column total column and lines 55-56 label the row total row.
I would like to add lines to my table by specifying cell ranges. I could do this more succinctly than I have in lines 58-73 but the code would be difficult to read. Lines 58-61 store the cells that define the four corners of the table to the local macros UpperLeft, UpperRight, BottomLeft, and BottomRight. Lines 63-73 use these four cells to define the cell ranges used to add the lines to the Excel table.
local RowVar = "sex"
local ColVar = "race"
tabulate `RowVar' if !missing(`ColVar'), matcell(rowtotals)
tabulate `ColVar' if !missing(`RowVar'), matcell(coltotals)
tabulate `RowVar' `ColVar', matcell(cellcounts)
local RowCount = r(r)
local ColCount = r(c)
local TotalCount = r(N)

levelsof `RowVar', local(RowLevels)
local RowValueLabel : value label `RowVar'

levelsof `ColVar', local(ColLevels)
local ColValueLabel : value label `ColVar'

putexcel set putexcel3.xlsx, sheet(example10) modify
forvalues row = 1/`RowCount' {

    local RowValueLabelNum = word("`RowLevels'", `row')
    local CellContents : label `RowValueLabel' `RowValueLabelNum'
    local Cell = char(64 + 1) + string(`row'+1)
    putexcel `Cell' = "`CellContents'", right

    local CellContents = rowtotals[`row',1]
    local Cell = char(64 + `ColCount' + 2) + string(`row' + 1)
    putexcel `Cell' = "`CellContents'", hcenter

    forvalues col = 1/`ColCount' {
	local cellcount = cellcounts[`row',`col']
	local cellpercent = string(100*`cellcount'/rowtotals[`row',1],"%9.1f")
	local CellContents = "`cellcount' (`cellpercent'%)"
	local Cell = char(64 + `col' + 1) + string(`row' + 1)
	putexcel `Cell' = "`CellContents'", right

	if `row'==1 {
		local ColValueLabelNum = word("`ColLevels'", `col')
		local CellContents : label `ColValueLabel' `ColValueLabelNum'
		local Cell = char(64 + `col' + 1) + string(1)
		putexcel `Cell' = "`CellContents'", hcenter

		local CellContents = coltotals[`col',1]
		local Cell = char(64 + `col' + 1) + string(`RowCount' + 2)
		putexcel `Cell' = "`CellContents'", hcenter
	}
    }
}

local Cell = char(64 + `ColCount' + 2) + string(`RowCount' + 2)
putexcel `Cell' = "`TotalCount'", hcenter

local Cell = char(64 + `ColCount' + 2) + string(1)
putexcel `Cell' = "Total", hcenter

local Cell = char(64 + 1) + string(`RowCount' + 2)
putexcel `Cell' = "Total", right

local UpperLeft = char(64 + 1)+ string(1)
local UpperRight = char(64 + `ColCount' + 2)+ string(1)
local BottomLeft = char(64 + 1)+ string(`RowCount'+2)
local BottomRight = char(64 + `ColCount' + 2)+ string(`RowCount'+2)

local CellRange =  "`UpperLeft':`UpperRight'"
putexcel `CellRange', border(bottom)

local CellRange =  "`BottomLeft':`BottomRight'"
putexcel `CellRange', border(top)

local CellRange =  "`UpperLeft':`BottomLeft'"
putexcel `CellRange', border(right)

local CellRange =  "`UpperRight':`BottomRight'"
putexcel `CellRange', border(left)
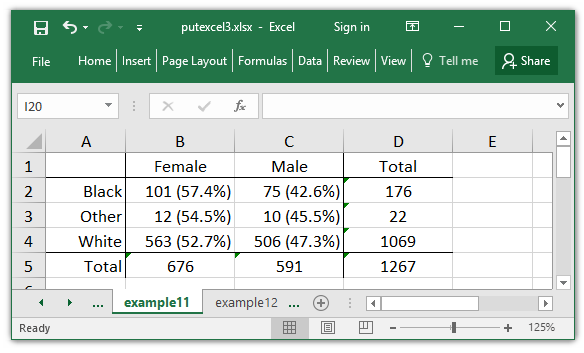
Example 11: Creating Excel tables for arbitrary variables
At this point, you may be wondering if it is worth investing the time necessary to write tables to Excel using this strategy. I could have created my Excel table manually in a fraction of the time it took me to write this program. But if I want to create this table, and tables like it many times in the future, this strategy will pay large dividends in time saved. For example, I can switch the rows and columns of my table by simply switching the variable assignments in lines 1 and 2 of Code block 9 below.
local RowVar = "race"
local ColVar = "sex"
tabulate `RowVar' if !missing(`ColVar'), matcell(rowtotals)
tabulate `ColVar' if !missing(`RowVar'), matcell(coltotals)
tabulate `RowVar' `ColVar', matcell(cellcounts)
local RowCount = r(r)
local ColCount = r(c)
local TotalCount = r(N)

levelsof `RowVar', local(RowLevels)
local RowValueLabel : value label `RowVar'

levelsof `ColVar', local(ColLevels)
local ColValueLabel : value label `ColVar'

putexcel set putexcel3.xlsx, sheet(example11) modify
forvalues row = 1/`RowCount' {

    local RowValueLabelNum = word("`RowLevels'", `row')
    local CellContents : label `RowValueLabel' `RowValueLabelNum'
    local Cell = char(64 + 1) + string(`row'+1)
    putexcel `Cell' = "`CellContents'", right

    local CellContents = rowtotals[`row',1]
    local Cell = char(64 + `ColCount' + 2) + string(`row' + 1)
    putexcel `Cell' = "`CellContents'", hcenter

    forvalues col = 1/`ColCount' {
	local cellcount = cellcounts[`row',`col']
	local cellpercent = string(100*`cellcount'/rowtotals[`row',1],"%9.1f")
	local CellContents = "`cellcount' (`cellpercent'%)"
	local Cell = char(64 + `col' + 1) + string(`row' + 1)
	putexcel `Cell' = "`CellContents'", right

	if `row'==1 {
		local ColValueLabelNum = word("`ColLevels'", `col')
		local CellContents : label `ColValueLabel' `ColValueLabelNum'
		local Cell = char(64 + `col' + 1) + string(1)
		putexcel `Cell' = "`CellContents'", hcenter

		local CellContents = coltotals[`col',1]
		local Cell = char(64 + `col' + 1) + string(`RowCount' + 2)
		putexcel `Cell' = "`CellContents'", hcenter
	}
    }
}

local Cell = char(64 + `ColCount' + 2) + string(`RowCount' + 2)
putexcel `Cell' = "`TotalCount'", hcenter

local Cell = char(64 + `ColCount' + 2) + string(1)
putexcel `Cell' = "Total", hcenter

local Cell = char(64 + 1) + string(`RowCount' + 2)
putexcel `Cell' = "Total", right

local UpperLeft = char(64 + 1)+ string(1)
local UpperRight = char(64 + `ColCount' + 2)+ string(1)
local BottomLeft = char(64 + 1)+ string(`RowCount'+2)
local BottomRight = char(64 + `ColCount' + 2)+ string(`RowCount'+2)

local CellRange =  "`UpperLeft':`UpperRight'"
putexcel `CellRange', border(bottom)

local CellRange =  "`BottomLeft':`BottomRight'"
putexcel `CellRange', border(top)

local CellRange =  "`UpperLeft':`BottomLeft'"
putexcel `CellRange', border(right)

local CellRange =  "`UpperRight':`BottomRight'"
putexcel `CellRange', border(left)
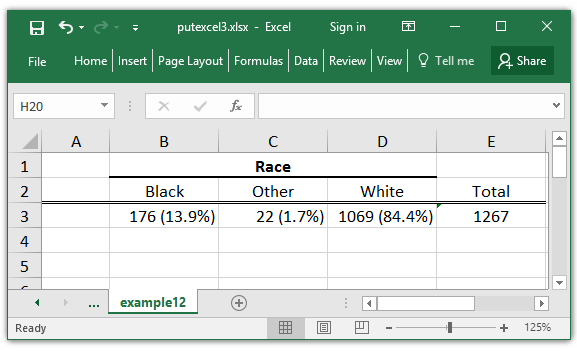
Example 12: Creating tables for continuous variables over levels of a categorical variable
Examples 1-11 demonstrated how to create a table for two categorical variables. I could use a similar approach to create a table of summary statistics for a continuous variable over levels of a categorical variable.
Let’s begin by creating a column header for the categorical variable race. The code in Code block 10 below looks similar to code used in Examples 1-11. The only unfamiliar code appears in line 6 where I store the variable label to the local macro ColVarLabel. I then write the variable label to the merged cells above the column labels in lines 25 and 26.
local ColVar = "race"
tabulate `ColVar', matcell(coltotals)
local ColCount = r(r)
local TotalCount = r(N)

6 local ColVarLabel : variable label `ColVar'

levelsof `ColVar', local(ColLevels)
local ColValueLabel : value label `ColVar'

putexcel set putexcel3.xlsx, sheet(example12) modify
forvalues col = 1/`ColCount' {
    local ColValueLabelNum = word("`ColLevels'", `col')
    local CellContents : label `ColValueLabel' `ColValueLabelNum'
    local Cell = char(64 + `col' + 1) + string(2)
    putexcel `Cell' = "`CellContents'", hcenter

    local cellcount = coltotals[`col',1]
    local cellpercent = string(100*`cellcount'/`TotalCount',"%9.1f")
    local CellContents = "`cellcount' (`cellpercent'%)"
    local Cell = char(64 + `col' + 1) + string(3)
    putexcel `Cell' = "`CellContents'", right
}

local CellRange = char(64 + 2) + string(1) + ":" + char(64 + `ColCount' + 1) + string(1)
putexcel `CellRange' = "`ColVarLabel'", merge hcenter bold border(bottom, medium)

local CellRange = char(64 + 1) + string(2) + ":" + char(64 + `ColCount' + 2) + string(2)
putexcel `CellRange', border(bottom, double)

local Cell = char(64 + `ColCount' + 2) + string(2)
putexcel `Cell' = "Total", hcenter

local Cell = char(64 + `ColCount' + 2) + string(3)
putexcel `Cell' = "`TotalCount'", hcenter
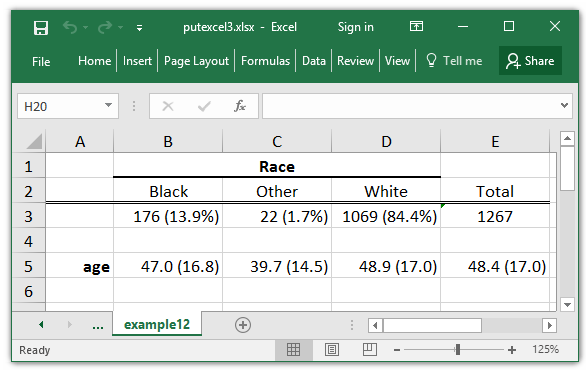
Example 12 (continued):
Next I can add a row that contains the mean and standard deviation of age for each level of race. I begin by storing age to the local macro ContVar in line 2 of Code block 11 below.
Lines 12 calculates the mean and standard deviation when the condition if `ColVar’==`ColLevel’ is true. You may be tempted to use the condition if `ColVar’==`col’ but it is best to avoid this temptation. The levels of categorical variables are often numbered with sequential integers starting with one (e.g. “1,2,3..”). But this is not always true. For example, indicator variables, such as sex, are numbered starting at zero. sex has two categories so if we used the condition if sex==1 we would see the results for males but we would see no results for the condition if sex==2. And we would never even consider the condition if sex==0.
. summarize age if sex==1

    Variable |        Obs        Mean    Std. Dev.       Min        Max
-------------+---------------------------------------------------------
         age |        590    48.25254    16.90086         20         74

. summarize age if sex==2

    Variable |        Obs        Mean    Std. Dev.       Min        Max
-------------+---------------------------------------------------------
         age |          0
Line 21 formats the returned mean, r(mean), to display with one decimal place and stores it to the local macro RowMean. Line 22 formats the returned standard deviation, r(sd), to display with one decimal place and stores it to the local macro RowSD. Line 15 combines RowMean and RowSD and store the result to the local macro CellContents.
Lines 20-25 repeat these calculations for the column total and lines 26-27 write the variable name age to the Excel table.
local ColVar = "race"
local ContVar = "age"
tabulate `ColVar', matcell(coltotals)
local ColCount = r(r)

levelsof `ColVar', local(ColLevels)
local ColValueLabel : value label `ColVar'

putexcel set putexcel3.xlsx, sheet(example12) modify
forvalues col = 1/`ColCount' {
    local ColLevel = word("`ColLevels'", `col')
    quietly summarize `ContVar' if `ColVar'==`ColLevel'
    local RowMean = string(`r(mean)', "%9.1f")
    local RowSD = string(`r(sd)', "%9.1f")
    local CellContents = "`RowMean' (`RowSD')"
    local Cell = char(64 + `col' + 1) + string(5)
    putexcel `Cell' = "`CellContents'", right
}

quietly summarize `ContVar' if !missing(`ColVar')
local RowMean = string(`r(mean)', "%9.1f")
local RowSD = string(`r(sd)', "%9.1f")
local CellContents = "`RowMean' (`RowSD')"
local Cell = char(64 + `ColCount' + 2) + string(5)
putexcel `Cell' = "`CellContents'", right

local Cell = char(64 + 1) + string(5)
putexcel `Cell' = "`ContVar'", right bold
Conclusion
I hope that this blog post has inspired you rather than intimidated you. Creating automated reports that work for arbitrary variables is never a quick and easy task. But generating these kinds of tables manually can be time consuming and frustrating. If you have ever spent hours formating tables for a manuscript only to have a reviewer insist that you modify your analysis in a way that changes all of the tables, you know what I’m talking about. Or perhaps you run weekly or monthly reports on data that is regularly updated. The time you invest in writing programs to automate your Excel tables can save far more time in the long run. And it will elimiate errors that can occur when you create tables manually.
Next time I will show you how to write your own Stata commands to create Excel tables.