Ermistatas and Stata’s new ERMs commands
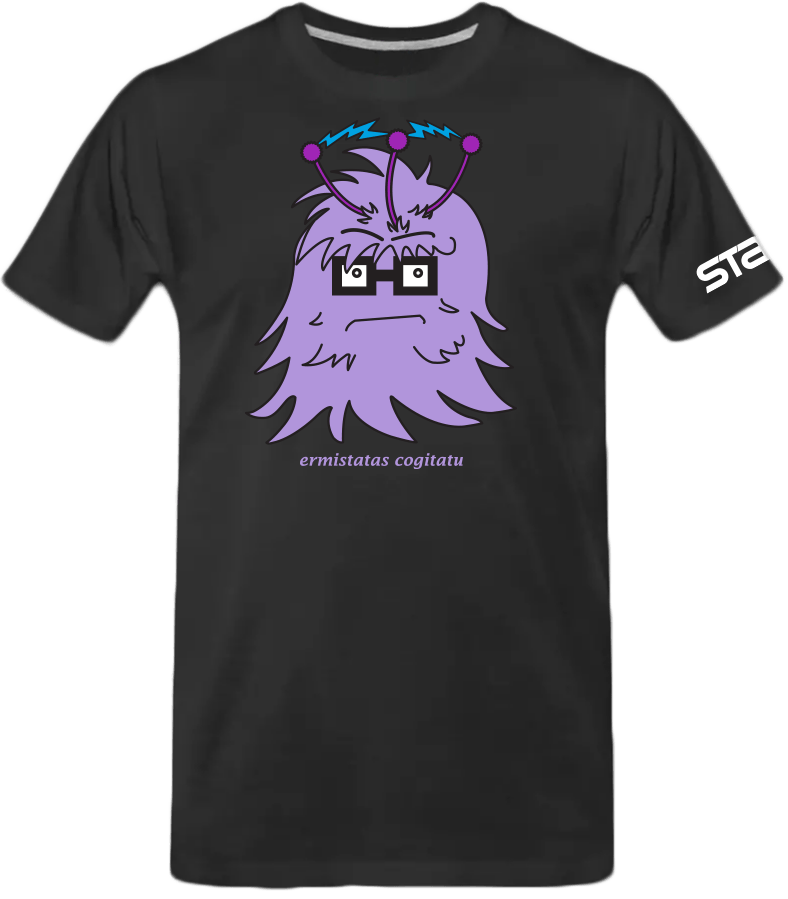
Ermistatas is our most popular t-shirt these days. See it and you will understand why.
We call the character Ermistatas and he is thinking—Ermistatas cogitatu. Notice the electricity bolts being emitted and received by his three antennae.
The shirt is popular even among those who do not use Stata and it’s leading them to ask questions. “Who or what is Ermistatas and why is he, she, or it deserving of a t-shirt?”. Then they add, “And why three and not the usual two antennae?”
Ermistatas is the creation of our arts-and-graphics department to represent Stata 15’s new commands for fitting Extended Regression Models—a term we coined. We call it ERMs for short. The new commands are Read more…

