How to create animated graphics to illustrate spatial spillover effects
6 March 2018
No comments
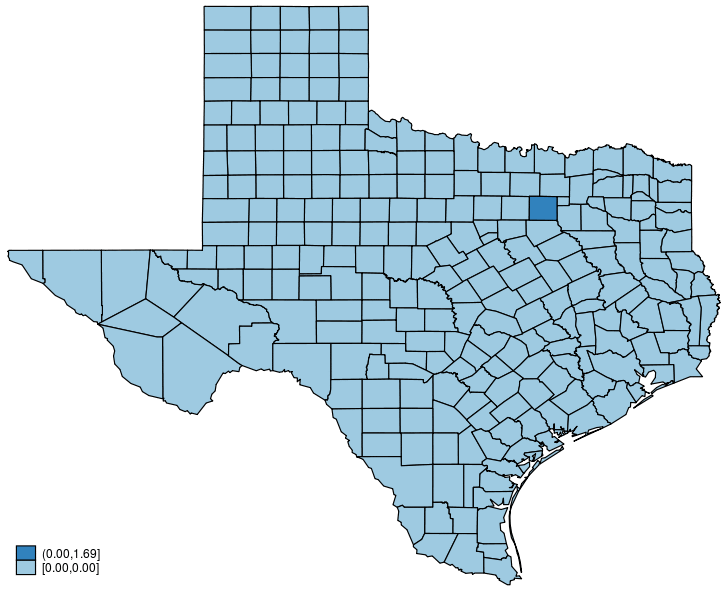
This post shows how to create animated graphics that illustrate the spatial spillover effects generated by a spatial autoregressive (SAR) model. After reading this post, you could create an animated graph like the following.
This post is organized as follows. First, I estimate the parameters of a SAR model. Second, I show why a SAR model can produce spatial spillover effects. Finally, I show how to create an animated graph that illustrates the spatial spillover effects. Read more…