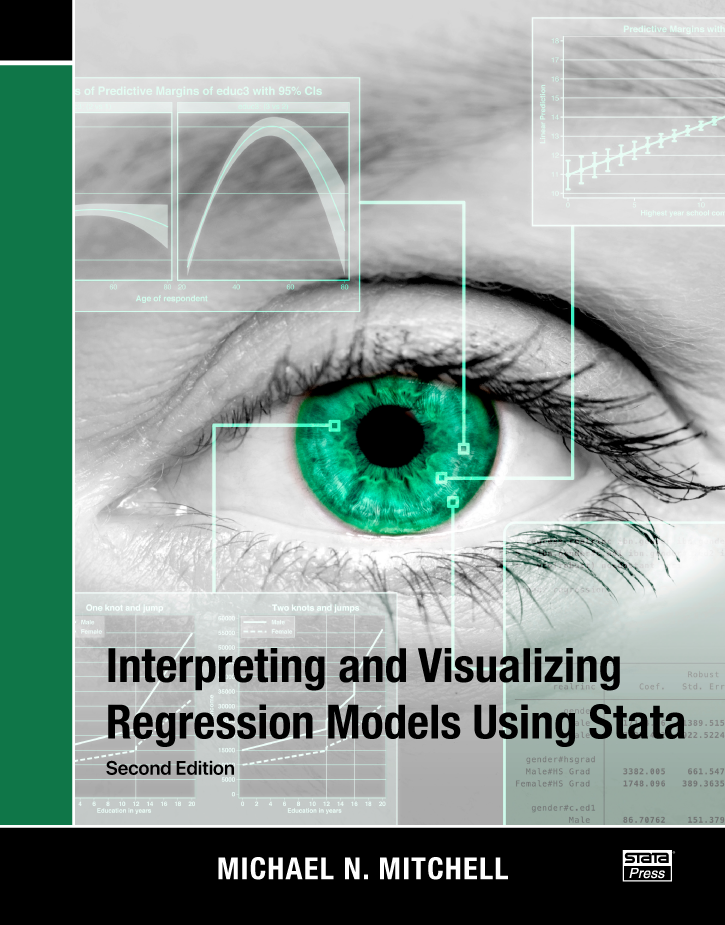
Just released from Stata Press: Interpreting and Visualizing Regression Models Using Stata, Second Edition
Stata Press is pleased to announce the release of Interpreting and Visualizing Regression Models Using Stata, Second Edition by Michael N. Mitchell.
Mitchell’s latest book is a clear treatment of how to carefully present results from model-fitting in a wide variety of settings. It is a boon to anyone who has to present the tangible meaning of a complex model clearly, regardless of the audience.
You will learn to fit models—from a simple linear regression with one covariate to more advanced models such as those with complex interactions, piecewise linear models, nonlinear models, and multilevel models. And you will see how graphs make interpreting even the most complicated models straightforward. You will also find out how you can answer interesting research questions by computing estimated marginal means, contrasts, tests for interactions, and simple effects of covariates after fitting any model.
New in the second edition: Learn how to use labels for easily interpretable results, customize Stata output, take advantage of transparency in graphs, and fit multilevel models that account for small sample sizes.
This book is a worthwhile addition to the library of anyone involved in statistical consulting, teaching, or collaborative applied statistical environments. Graphs greatly aid the interpretation of regression models, and Mitchell’s book shows you how. It is available in paperback, eBook, and Kindle formats.
There are many upcoming releases of Stata Press books. To see the full list of forthcoming books, please visit our forthcoming page. While you are there, sign up for alerts, and be the first to know when a new book is released. Visit Stata Press to see our complete list of books.
