As of November 2019, this command no longer works because of https://stats.nba.com restrictions.
Since our intern, Chris Hassell, finished nfl2stata earlier than expected, he went ahead and created another command to web scrape https://stats.nba.com for data on the NBA. The command is nba2stata. To install the command type
net install http://www.stata.com/users/kcrow/nba2stata, replace
Read more…
Automating common tasks is crucial to effective data analysis. Automation saves you lots of time from repeating the same sets of operations, and it reduces errors by reducing what you have to repeat.
Let’s automate something using Stata. The task we are automating doesn’t much matter. What matters is that we get comfortable with how to automate tasks.
We will automate the simple task of normalizing a variable. That is to say, subtracting the variable’s mean and dividing by its standard deviation.
Just so you know, there are already community-contributed commands to do this and to do it more flexibly than we will. Type search normalize variable in Stata, and you will see one of those commands. (You will see things about other types of normalization that have nothing to do with normalizing a variable, but the command of interest is easy to pick out.) You can also normalize a single variable using Stata’s egen command, but we are going to do more than that.
As with all the articles in this series, I assume the reader is new to automating tasks in Stata. So, if you are already an expert, these articles may hold little interest for you. Or perhaps you will still find something novel. Read more…
You want a graph that most effectively communicates your message. You want a graph that fits the style of your journal. You want a graph with colors that everyone can differentiate. Or you want a graph in grayscale. Read more…
The nfl2stata command no longer works due to website changes.
Football season is around the corner, and I could not be more excited. We have a pretty competitive StataCorp fantasy football league. I’m always looking for an edge in our league, so I challenged one of our interns, Chris Hassell, to write a command to web scrape http://www.nfl.com for data on the NFL. The new command is nfl2stata. To install the command, type
net install http://www.stata.com/users/kcrow/nfl2stata, replace
Read more…
In his blog post, Enrique Pinzon discussed how to perform regression when we don’t want to make any assumptions about functional form—use the npregress command. He concluded by asking and answering a few questions about the results using the margins and marginsplot commands.
Recently, I have been thinking about all the different types of questions that we could answer using margins after nonparametric regression, or really after any type of regression. margins and marginsplot are powerful tools for exploring the results of a model and drawing many kinds of inferences. In this post, I will show you how to ask and answer very specific questions and how to explore the entire response surface based on the results of your nonparametric regression.
Read more…
It’s summer time, which means we have interns working at StataCorp again. Our newest intern, Chris Hassell, was tasked with updating my community-contributed command tab2xl with most of the suggestions that blog readers left in the comments. Chris updated tab2xl and wrote tab2docx, which writes a tabulation table to a Word file using the putdocx command.
Read more…
What are DSGE models?
Dynamic stochastic general equilibrium (DSGE) models are used by macroeconomists to model multiple time series. A DSGE model is based on economic theory. A theory will have equations for how individuals or sectors in the economy behave and how the sectors interact. What emerges is a system of equations whose parameters can be linked back to the decisions of economic actors. In many economic theories, individuals take actions based partly on the values they expect variables to take in the future, not just on the values those variables take in the current period. The strength of DSGE models is that they incorporate these expectations explicitly, unlike other models of multiple time series.
DSGE models are often used in the analysis of shocks or counterfactuals. A researcher might subject the model economy to an unexpected change in policy or the environment and see how variables respond. For example, what is the effect of an unexpected rise in interest rates on output? Or a researcher might compare the responses of economic variables with different policy regimes. For example, a model might be used to compare outcomes under a high-tax versus a low-tax regime. A researcher would explore the behavior of the model under different settings for tax rate parameters, holding other parameters constant.
In this post, I show you how to estimate the parameters of a DSGE model, how to create and interpret an impulse response, and how to compare the impulse response estimated from the data with an impulse response generated by a counterfactual policy regime. Read more…
Ermistatas is our most popular t-shirt these days. See it and you will understand why.

We call the character Ermistatas and he is thinking—Ermistatas cogitatu. Notice the electricity bolts being emitted and received by his three antennae.
The shirt is popular even among those who do not use Stata and it’s leading them to ask questions. “Who or what is Ermistatas and why is he, she, or it deserving of a t-shirt?”. Then they add, “And why three and not the usual two antennae?”
Ermistatas is the creation of our arts-and-graphics department to represent Stata 15’s new commands for fitting Extended Regression Models—a term we coined. We call it ERMs for short. The new commands are Read more…
Categories: Statistics Tags: binary outcomes, confounders, continuous outcomes, endogeneity, endogenous selection, ERMs, extended regression models, Heckman, interval outcomes, intreg, linear regression, oprobit, ordered outcomes, probit, sample selection, statistics, treatment, treatment assignment, treatment effects, unobserved confounding
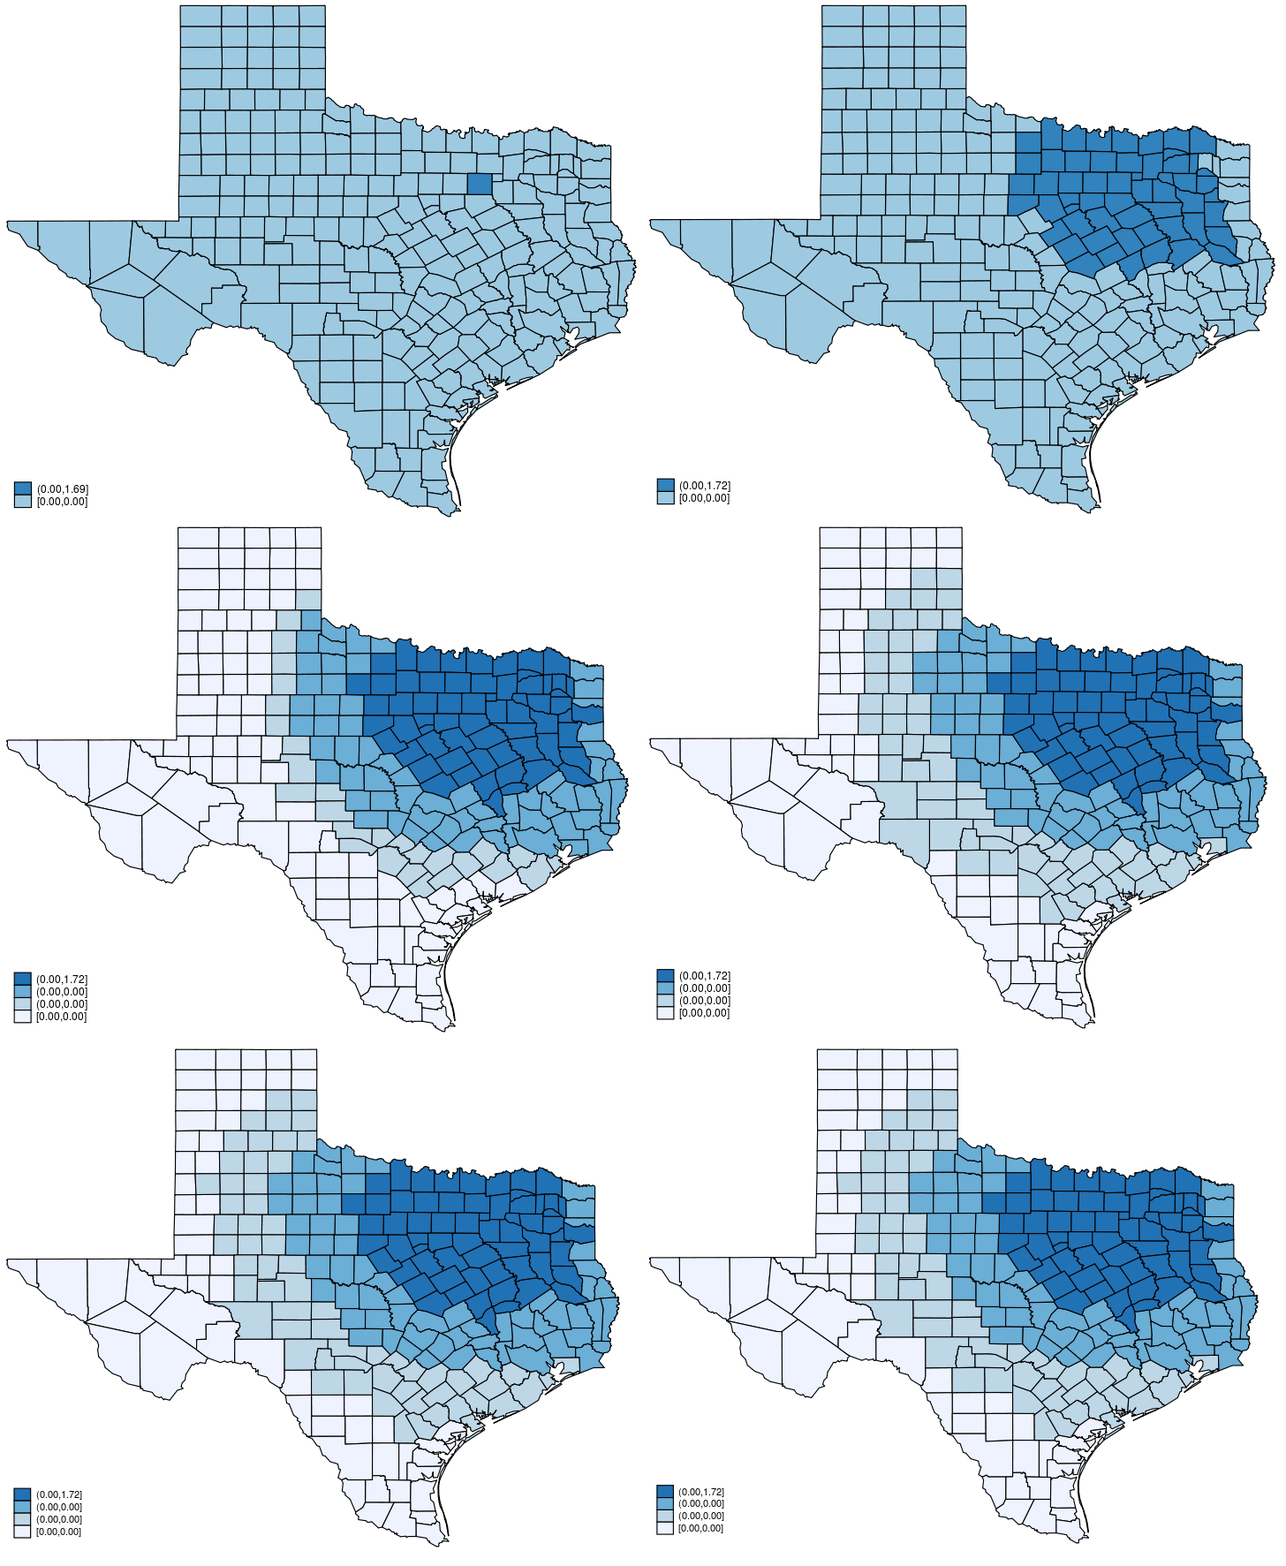
This post shows how to create animated graphics that illustrate the spatial spillover effects generated by a spatial autoregressive (SAR) model. After reading this post, you could create an animated graph like the following.

This post is organized as follows. First, I estimate the parameters of a SAR model. Second, I show why a SAR model can produce spatial spillover effects. Finally, I show how to create an animated graph that illustrates the spatial spillover effects. Read more…
“The book that Stata programmers have been waiting for” is how the Stata Press describes my new book on Mata, the full title of which is
The Mata Book: A Book for Serious Programmers and Those Who Want to Be
The Stata Press took its cue from me in claiming that it this the book you have been waiting for, although I was less presumptuous in the introduction:
This book is for you if you have tried to learn Mata by reading the Mata Reference Manual and failed. You are not alone. Though the manual describes the parts of Mata, it never gets around to telling you what Mata is, what is special about Mata, what you might do with Mata, or even how Mata’s parts fit together. This book does that.
I’m excited about the book, but for a while I despaired of ever completing it. I started and stopped four times. I stopped because the drafts were boring. Read more…

